AWS: Monitoring AWS OpenSearch Service cluster with CloudWatch
Configuring AWS OpenSearch Service cluster monitoring with CloudWatch, monitoring JVM memory and k-NN, creating Grafana dashboards and alerts in Alertmanager
Let’s continue our journey with AWS OpenSearch Service.
What we have is a small AWS OpenSearch Service cluster with three data nodes, used as a vector store for AWS Bedrock Knowledge Bases.
Previous parts:
AWS: Creating an OpenSearch Service cluster and configuring authentication and authorization
Terraform: creating an AWS OpenSearch Service cluster and users
We already had our first production incident :-)
We launched a search without filters, and our t3.small.search died due to CPU overload.
So let’s take a look at what we have in terms of monitoring all this happiness.
Now let’s do something basic, just with CloudWatch metrics, but there are several solutions for monitoring OpenSearch:
CloudWatch metrics from OpenSearchService itself - data on CPU, memory, and JVM, which we can collect in VictoriaMetrics and generate alerts or use in the Grafana dashboard, see Monitoring OpenSearch cluster metrics with Amazon CloudWatch
CloudWatch Events generated by OpenSearch Service - see Monitoring OpenSearch Service events with Amazon EventBridge - can be sent via SNS to Opsgenie, and from there to Slack.
Logs in CloudWatch Logs - we can collect them in VictoriaLogs and generate some metrics and alerts, but I didn’t see anything interesting in the logs during our production incident, see Monitoring OpenSearch logs with Amazon CloudWatch Logs.
Monitors of OpenSearch itself - capable of anomaly detection and custom alerting, there is even a Terraform resource
opensearch_monitor, see also Configuring alerts in Amazon OpenSearch ServiceThere is also the Prometheus Exporter Plugin, which opens an endpoint for collecting metrics from Prometheus/VictoriaMetrics (but it cannot be added to AWS OpenSearch Managed, although support promises that there is a feature request - maybe it will be added someday).
Contents
CloudWatch metrics
Memory monitoring
kNN Memory usage
JVM Memory usage
Collecting metrics to VictoriaMetrics
Creating a Grafana dashboard
VictoriaMetrics/Prometheus sum(), avg() та max()
Cluster status
Nodes status
CPUUtilization: Stats
CPUUtilization: Graph
JVMMemoryPressure: Graph
JVMGCYoungCollectionCount and JVMGCOldCollectionCount
KNNHitCount vs KNNMissCount
Final result
t3.small.search vs t3.medium.search on graphs
Creating Alerts
CloudWatch metrics
There are quite a few metrics, but the ones that may be of interest to us are those that take into account the fact that we do not have dedicated master and coordinator nodes, and we do not use ultra-warm and cold instances.
Cluster metrics:
ClusterStatus:green/yellow/red- the main indicator of cluster status, control of data shard activityShards:active/unassigned/delayedUnassigned/activePrimary/initializing/relocating- more detailed information on the status of shards, but here is just the total number, without details on specific indexesNodes: the number of nodes in the cluster - knowing how many live nodes there should be - we can alert when a node goes downSearchableDocuments: not that it’s particularly interesting to us, but it might be useful later on to see what’s going on in the indexes in general.CPUUtilization: the percentage of CPU usage across all nodes, and this is a must-haveFreeStorageSpace: also useful to monitorClusterIndexWritesBlocked: Is everything OK with index writes?JVMMemoryPressureandOldGenJVMMemoryPressure: percentage of JVM heap memory usage - we’ll dig into JVM monitoring separately later, because it’s a whole other headache.AutomatedSnapshotFailure: probably good to know if the backup failsCPUCreditBalance: useful for us because we are ont3instances (but we don’t have it in CloudWatch)2xx,3xx,4xx,5xx: data on HTTP requests and errorsI only collect
5xxfor alerts here
ThroughputThrottleandIopsThrottle: we encountered disk access issues in RDS, so it is worth monitoring here as well, see PostgreSQL: AWS RDS Performance and monitoringHere you will need to look at the metrics from EBS volume metrics, but for start, you can simply add alerts to Throttle in general
HighSwapUsage: similar to the previous metrics - we once had a problem with RDS, so it’s better to monitor this as well.
EBS volume metrics - these are basically standard EBS metrics, as for EC2 or RDS:
ReadLatencyandWriteLatency: read/write delayssometimes there are spikes, so you can add
ReadThroughputandWriteThroughput: total disk load, let’s say this wayDiskQueueDepth: I/O operations queueis empty in CloudWatch (for now?), so we’ll skip it
ReadIOPSandWriteIOPS: number of read/write operations per second
Instance metrics - here are the metrics for each OpenSearch instance (not the server, EC2, but OpenSearch itself) on each node:
FetchLatencyandFetchRate: how quickly we get data from shards (but I couldn’t find it in CloudWatch either)ThreadCount: the number of threads in the operating system that were created by the JVM (Garbage Collector threads, search threads, write/index threads, etc.)The value is stable in CloudWatch, but for now, we can add it to Grafana for the overall picture and see if there is anything interesting there
ShardReactivateCount: how often shards are transferred from cold/inactive states to active ones, which requires operating system resources, CPU, and memory; Well... maybe we should check if it has any significance for us at all.But there is nothing in CloudWatch either - “did not match any metrics“
ConcurrentSearchRateandConcurrentSearchLatency: the number and speed of simultaneous search requests - this can be interesting if there are many parallel requests hanging for a long timebut for us (yet?), these values are constantly at zero, so we skip them
SearchRate: number of search queries per minute, useful for the overall pictureSearchLatency: search query execution speed, probably very useful, you can even set up an alertIndexingRateandIndexingLatency: similar, but for indexing new documentsSysMemoryUtilization: percentage of memory usage on the data node, but this does not give a complete picture; you need to look at the JVM memory.JVMGCYoungCollectionCountandJVMGCOldCollectionCount: the number of Garbage Collector runs, useful in conjunction with JVM memory data, which we will discuss in more detail later.SearchTaskCancelledandSearchShardTaskCancelled: bad news :-) if tasks are canceled, something is clearly wrong (either the user interrupted the request, or there was an HTTP connection reset, or timeouts, or cluster load)but we always have zeroes, even when the cluster went down, so I don’t see the point in collecting these metrics yet
ThreadpoolIndexQueueandThreadpoolSearchQueue: the number of tasks for indexing and searching in the queue; when there are too many of them, we getThreadpoolIndexRejectedandThreadpoolSearchRejectedThreadpoolIndexQueueis not available in CloudWatch at all, andThreadpoolSearchQueueis there, but it’s also constantly at zero, so we’re skipping it for now
ThreadpoolIndexRejectedandThreadpoolSearchRejected: actually, abovein CloudWatch, the picture is similar -
ThreadpoolIndexRejectedis not present at all,ThreadpoolSearchRejectedis zero
ThreadpoolIndexThreadsandThreadpoolSearchThreads: the maximum number of operating system threads for indexing and searching; if all are busy, requests will go toThreadpoolIndexQueue/ThreadpoolSearchQueueOpenSearch has several types of pools for threads - search, index, write, etc., and each pool has a threads indicator (how many are allocated), see OpenSearch Threadpool.
The Node Stats API (
GET _nodes/stats/thread_pool) has an active threads metric, but I don’t see it in CloudWatch.ThreadpoolIndexThreadsis not available in CloudWatch at all, andThreadpoolSearchThreadsis static, so I think we can skip monitoring them for now.
PrimaryWriteRejected: rejected write operations in primary shards due to issues in the thread pool write or index, or load on the data nodeCloudWatch is empty for now, but we will add collection and alerts
ReplicaWriteRejected: rejected write operations in replica shards - added to the primary document, but cannot be written to the replicaCloudWatch is empty for now, but we will add collection and alerts
k-NN metrics - useful for us because we have a vector store with k-NN:
KNNCacheCapacityReached: when the cache is full (see below)KNNEvictionCount: how often data is removed from the cache - a sign that there is not enough memoryKNNGraphMemoryUsage: off-heap memory usage for the vector graph itselfKNNGraphQueryErrors: number of errors when searching in vectorsin CloudWatch are empty for now, but we will add collection and alert
KNNGraphQueryRequests: total number of queries to k-NN graphsKNNHitCountandKNNMissCount: how many results were returned from the cache, and how many had to be read from the diskKNNTotalLoadTime: speed of loading from disk to cache (large graphs or loaded EBS - time will increase)
Memory monitoring
Let’s think about how we can monitor the main indicators, starting with memory, because, well, this is Java.
What do we have about memory metrics?
SysMemoryUtilization: percentage of memory usage on the server (data node) in generalJVMMemoryPressure: total percentage of JVM Heap usage; JVM Heap is allocated by default to 50% of the server’s memory, but no more than 32 gigabytes.OldGenJVMMemoryPressure: see belowKNNGraphMemoryUsage: this was discussed in the first post - AWS: introduction to OpenSearch Service as a vector storeCloudWatch also has a metric called
KNNGraphMemoryUsagePercentage, but it is not included in the documentation
kNN Memory usage
First, a brief overview of k-NN memory.
So, on EC2, we allocate memory for the JVM Heap (50% of what is available on the server) and separately for the off-heap for the OpenSearch vector store, where it keeps graphs and cache. For vector store, see Approximate k-NN search, plus the operating system itself and its file cache.
We don’t have a metric like “KNNGraphMemoryAvailable,” but with KNNGraphMemoryUsagePercentage and KNNGraphMemoryUsage, we can calculate it:
KNNGraphMemoryUsage: we currently have 662 megabytesKNNGraphMemoryUsagePercentage: 60%
This means that 1 gigabyte is allocated outside the JVM Heap memory for k-NN graphs (this is on t3.medium.search).
From the documentation k-Nearest Neighbor (k-NN) search in Amazon OpenSearch Service:
OpenSearch Service uses half of an instance’s RAM for the Java heap (up to a heap size of 32 GiB). By default, k-NN uses up to 50% of the remaining half
Knowing that we currently have t3.medium.search, which provides 4 gigabytes of memory - 2 GB goes to the JVM Heap, and 1 gigabyte goes to the k-NN graph.
The main part of KNNGraphMemory is used by the k-NN cache, i.e., the part of the system’s RAM where OpenSearch keeps HNSW graphs from vector indexes so that they do not have to be read from disk each time (see k-NN clear cache).
Therefore, it is useful to have graphs for EBS IOPS and k-NN cache usage.
JVM Memory usage
Okay, let’s review what’s going on in Java in general. See What Is Java Heap Memory?, OpenSearch Heap Size Usage and JVM Garbage Collection, and Understanding the JVMMemoryPressure metric changes in Amazon OpenSearch Service.
To put it simply:
Stack Memory: in addition to the JVM Heap, we have a Stack, which is allocated to each thread, where it keeps its variables, references, and startup parameters
set via
-Xss, default value from 256 kilobytes to 1 megabyte, see Understanding Threads and Locks (couldn’t find how to view in OpenSearch Service)if we have many threads, there will be a lot of memory for their stacks
cleared when the thread dies
Heap Space:
used to allocate memory that is available to all threads
managed by Garbage Collectors (GC)
in the context of OpenSearch, we will have search and indexation caches here
In Heap memory, we have:
Young Generation: fresh data, all new objects
data from here is either deleted completely or moved to Old Generation
Old Generation: the OpenSearch process code itself, caches, Lucene index structures, large arrays
If OldGenJVMMemoryPressure is full, it means that the Garbage Collector cannot clean it up because there are references to the data, and then we have a problem - because there is no space in the Heap for new data, and the JVM may crash with an OutOfMemoryError.
In general, “heap pressure” is when there is little free memory in Young Gen and Old Gen, and there is nowhere to place new data to respond to clients.
This leads to frequent Garbage Collector runs, which take up time and system resources - instead of processing requests from clients.
As a result, latency increases, indexing of new documents slows down, or we get ClusterIndexWritesBlocked - to avoid Java OutOfMemoryError, because when indexing, OpenSearch first writes data to the Heap and then “dumps” it to disk.
See Key JVM Metrics to Monitor for Peak Java Application Performance.
So, to get a picture of memory usage, we monitor:
SysMemoryUtilization- for an overall picture of the EC2 statusin our case, it will be consistently around 90%, but that’s OK
JVMMemoryPressure- for an overall picture of the JVMshould be cleaned regularly with Garbage Collector (GC)
if it is constantly above 80-90%, there are problems with running GC
OldGenJVMMemoryPressure- for Old Generation Heap datashould be at 30-40%; if it is higher and is not being cleared, then there are problems either with the code or with GC
KNNGraphMemoryUsage- in our case, this is necessary for the overall picture
It is worth adding alerts for HighSwapUsage - we already had active swapping when we launched on t3.small.search, and this is an indication that there is not enough memory.
Collecting metrics to VictoriaMetrics
So, how do you choose metrics?
First, we look for them in CloudWatch Metrics and see if the metric exists at all and if it returns any interesting data.
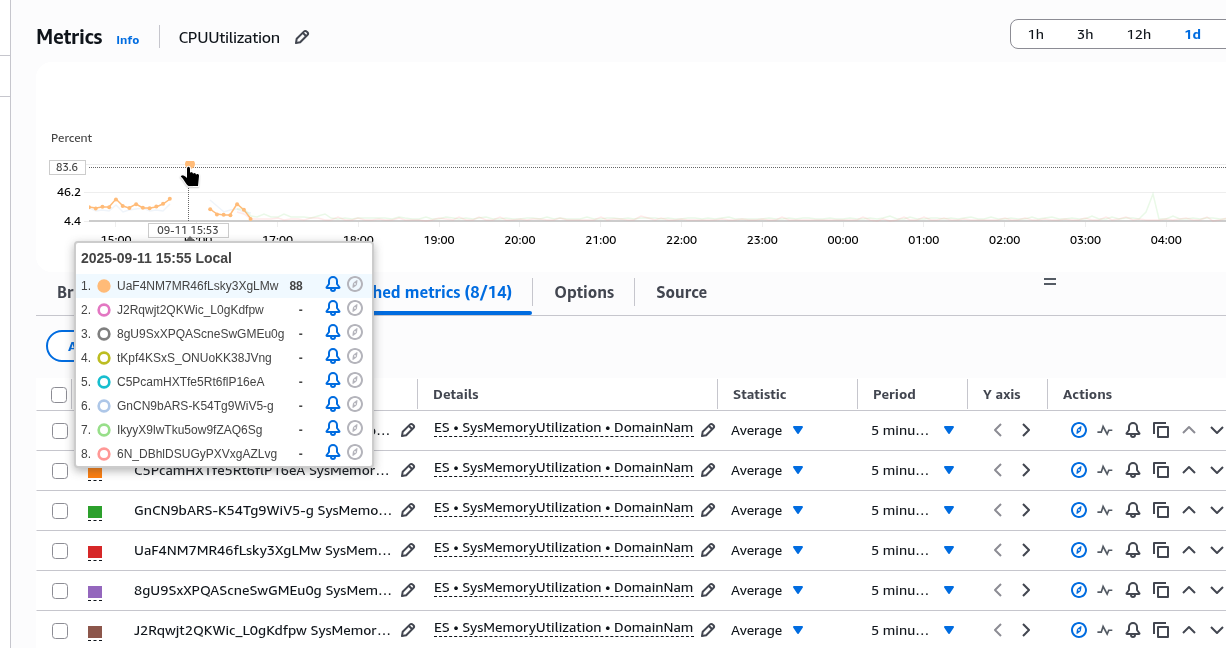
For example, SysMemoryUtilization provides information.
Here we had a spike on t3.small.search, after which the cluster crashed:
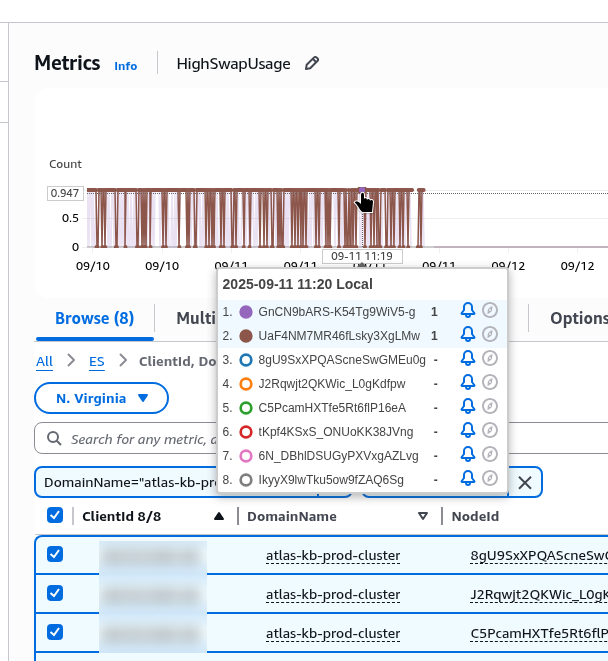
But the HighSwapUsage metric also needs to be moved to t3.medium.search:
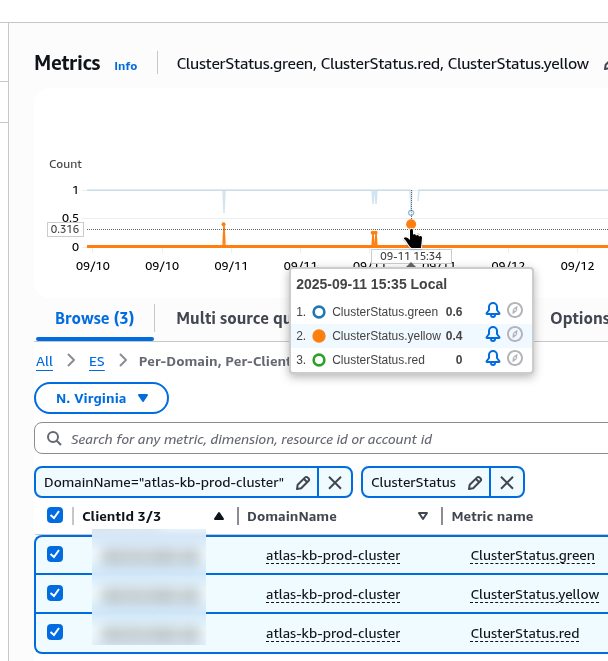
ClusterStatus is here:
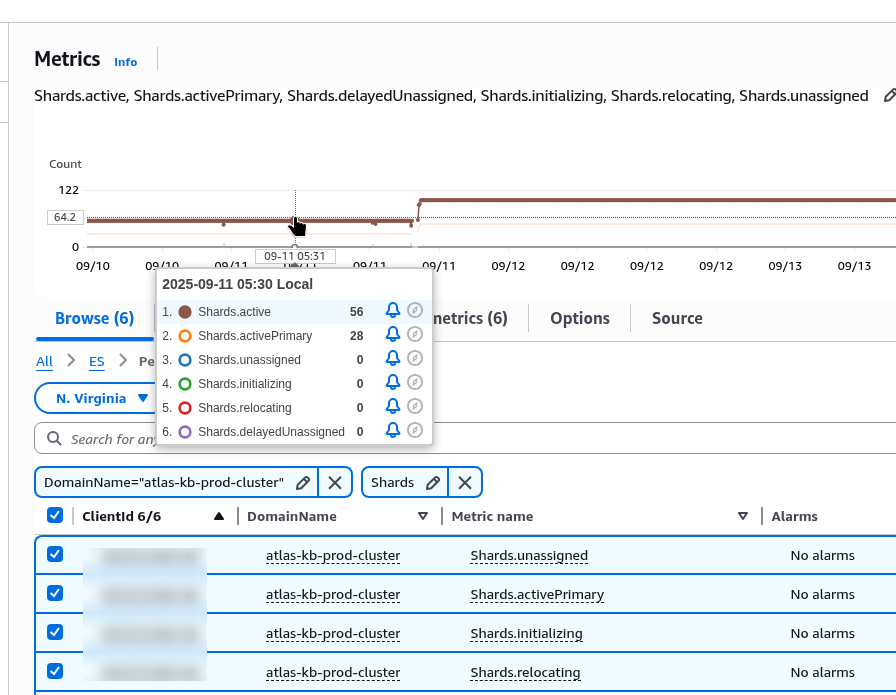
Shards exist, but they are indexed by all criteria, and there is no way to filter by individual criteria:
It is also important to note that collecting metrics from CloudWatch also costs money for API requests, so it is not advisable to collect everything indiscriminately.
In general, we use YACE (Yet Another CloudWatch Exporter) to collect metrics from CloudWatch, but it does not support OpenSearch Managed cluster, see Features.
Therefore, we will use a standard exporter - CloudWatch Exporter.
We deploy it from the Helm monitoring chart (see VictoriaMetrics: creating a Kubernetes monitoring stack with your own Helm chart), add a new config to it:
...

prometheus-cloudwatch-exporter:
  enabled: true
  serviceAccount:
    name: “cloudwatch-sa”
    annotations:
      eks.amazonaws.com/sts-regional-endpoints: “true”
  serviceMonitor:
    enabled: true
  config: |-
    region: us-east-1
    metrics:

    - aws_namespace: AWS/ES
      aws_metric_name: KNNGraphMemoryUsage
      aws_dimensions: [ClientId, DomainName, NodeId]
      aws_statistics: [Average]

    - aws_namespace: AWS/ES
      aws_metric_name: SysMemoryUtilization
      aws_dimensions: [ClientId, DomainName, NodeId]
      aws_statistics: [Average]

    - aws_namespace: AWS/ES
      aws_metric_name: JVMMemoryPressure
      aws_dimensions: [ClientId, DomainName, NodeId]
      aws_statistics: [Average]

    - aws_namespace: AWS/ES
      aws_metric_name: OldGenJVMMemoryPressure
      aws_dimensions: [ClientId, DomainName, NodeId]
      aws_statistics: [Average]
Please note that different metrics may have different Dimensions - check them in CloudWatch:
Deploy, check:
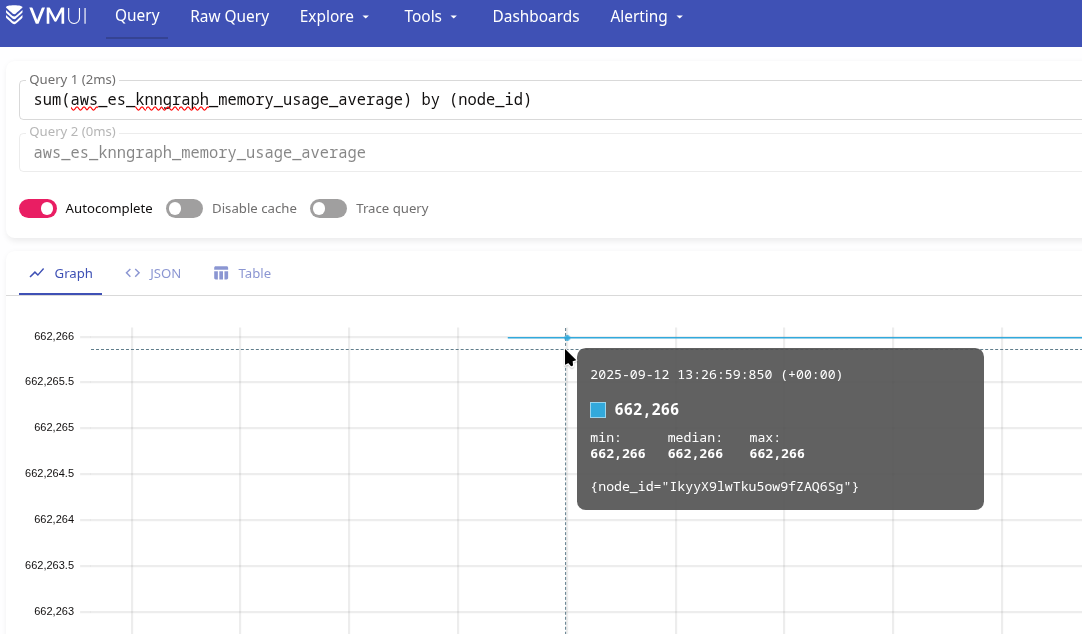
And even the numbers turned out to be as we calculated in the first post - we have ~130,000 documents in the production index, according to the formula num_vectors * 1.1 * (4*1024 + 8*16) , which equals 604032000 bytes, or 604.032 megabytes.
And on the graph we have 662,261 kilobytes - that’s 662 megabytes, but across all indexes combined.
Now we have metrics in VictoriaMetrics - aws_es_knngraph_memory_usage_average, aws_es_sys_memory_utilization_average, aws_es_jvmmemory_pressure_average, aws_es_old_gen_jvmmemory_pressure_average.
Add the rest in the same way.
To find out what metrics are called in VictoriaMetrics/Prometheus, open the port to CloudWatch Exporter:
$ kk port-forward svc/atlas-victoriametrics-prometheus-cloudwatch-exporter 9106And with curl and grep, search for metrics:
$ curl -s localhost:9106/metrics | grep aws_es
# HELP aws_es_cluster_status_green_maximum CloudWatch metric AWS/ES ClusterStatus.green Dimensions: [ClientId, DomainName] Statistic: Maximum Unit: Count
# TYPE aws_es_cluster_status_green_maximum gauge
aws_es_cluster_status_green_maximum{job=”aws_es”,instance=”“,domain_name=”atlas-kb-prod-cluster”,client_id=”492***148”,} 1.0 1758014700000
# HELP aws_es_cluster_status_yellow_maximum CloudWatch metric AWS/ES ClusterStatus.yellow Dimensions: [ClientId, DomainName] Statistic: Maximum Unit: Count
# TYPE aws_es_cluster_status_yellow_maximum gauge
aws_es_cluster_status_yellow_maximum{job=”aws_es”,instance=”“,domain_name=”atlas-kb-prod-cluster”,client_id=”492***148”,} 0.0 1758014700000
# HELP aws_es_cluster_status_red_maximum CloudWatch metric AWS/ES ClusterStatus.red Dimensions: [ClientId, DomainName] Statistic: Maximum Unit: Count
# TYPE aws_es_cluster_status_red_maximum gauge
aws_es_cluster_status_red_maximum{job=”aws_es”,instance=”“,domain_name=”atlas-kb-prod-cluster”,client_id=”492***148”,} 0.0 1758014700000
...
Creating a Grafana dashboard
OK, we have metrics from CloudWatch - that’s enough for now.
Let’s think about what we want to see in Grafana.
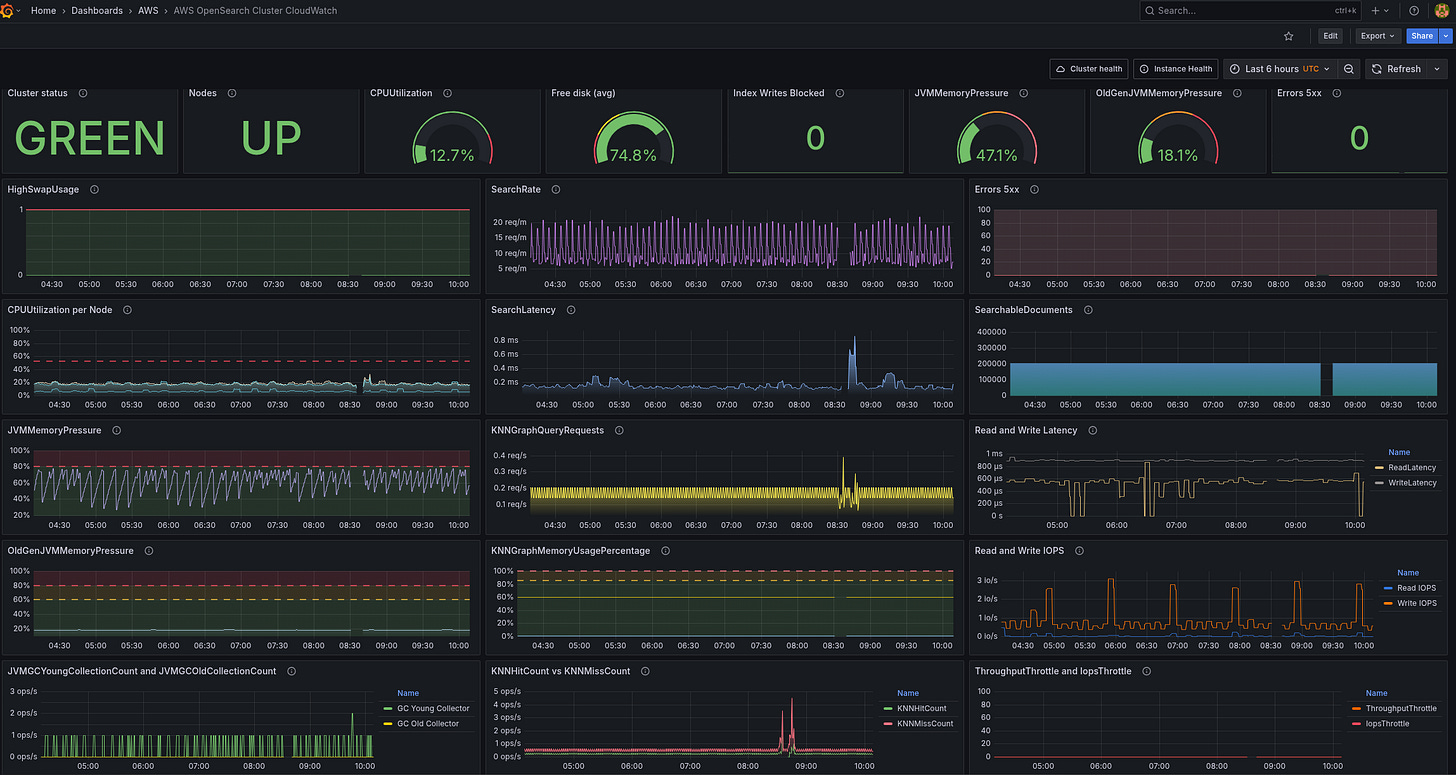
The general idea is to create a kind of dashboard overview, where all the key data for the cluster will be displayed on a single board.
What metrics are currently available, and how can we use them in Grafana? I wrote them down here so as not to get confused, because there are quite a few of them:
aws_es_cluster_status_green_maximum,aws_es_cluster_status_yellow_maximum,aws_es_cluster_status_red_maximum: you can create a single Stats panelaws_es_nodes_maximum: also some kind of stats panel - we know how many there should be, and we’ll mark it red when there are fewer Data Nodes than there should be.aws_es_searchable_documents_maximum: just for fun, we will show the number of documents in all indexes together in a graphaws_es_cpuutilization_average: one graph per node, and some Stats with general information and different colorsaws_es_free_storage_space_maximum: just Statsaws_es_cluster_index_writes_blocked_maximum: did not add to Grafana, only alertaws_es_jvmmemory_pressure_average: graph and statsaws_es_old_gen_jvmmemory_pressure_average: somewhere nearby, also graph + Statsaws_es_automated_snapshot_failure_maximum: this is just for alertingaws_es_5xx_maximum: both graph and Statsaws_es_iops_throttle_maximum: graph to see in comparison with other data such as CPU/Mem usageaws_es_throughput_throttle_maximum: графікaws_es_high_swap_usage_maximum: both graph and Stats - graph, to see in comparison with CPU/disksaws_es_read_latency_average: graphaws_es_write_latency_average: graphaws_es_read_throughput_average: I didn’t add it because there are too many graphs.aws_es_write_throughput_average: I didn’t add it because there are too many graphs.aws_es_read_iops_average: a graph that is useful for understanding how the k-NN cache works - if there is not enough of it (and we tested ont3.small.searchwith 2 gigabytes of total memory), then there will be a lot of reading from the disk.aws_es_write_iops_average: similarlyaws_es_thread_count_average: I didn’t add it because it’s pretty static and I didn’t see any particularly useful information in it.aws_es_search_rate_average: also just a graphaws_es_search_latency_average: similarly, somewhere nearbyaws_es_sys_memory_utilization_average: Well, it will constantly be around 90% until I remove it from Grafana, but I added it to alerts.aws_es_jvmgcyoung_collection_count_average: graph showing how often it is calledaws_es_jvmgcold_collection_count_average: graph showing how often it is calledaws_es_primary_write_rejected_average: graph, but I haven’t added it yet because there are too many graphs - only alertsaws_es_replica_write_rejected_average: graph, but I haven’t added it yet because there are too many graphs - only alertsk-NN:
aws_es_knncache_capacity_reached_maximum: only for warning alertsaws_es_knneviction_count_average: did not add, although it may be interestingaws_es_knngraph_memory_usage_average: did not addaws_es_knngraph_memory_usage_percentage_maximum: graph instead ofaws_es_knngraph_memory_usage_averageaws_es_knngraph_query_errors_maximum: alert onlyaws_es_knngraph_query_requests_sum: graphaws_es_knnhit_count_maximum: graphaws_es_knnmiss_count_maximum: graphaws_es_knntotal_load_time_sum: it would be nice to have a graph, but there is no space on the board
VictoriaMetrics/Prometheus sum(), avg() та max()
First, let’s recall what functions we have for data aggregation.
With CloudWatch for OpenSearch, we will receive two main types: counter and gauge:
$ curl -s localhost:9106/metrics | grep cpuutil
# HELP aws_es_cpuutilization_average CloudWatch metric AWS/ES CPUUtilization Dimensions: [ClientId, DomainName, NodeId] Statistic: Average Unit: Percent
# TYPE aws_es_cpuutilization_average gauge
aws_es_cpuutilization_average{job=”aws_es”,instance=”“,domain_name=”atlas-kb-prod-cluster”,node_id=”BzX51PLwSRCJ7GrbgB4VyA”,client_id=”492***148”,} 10.0 1758099600000
...
The difference between them:
counter: the value can only increase the value
gauge: the value can increase and decrease
Here we have “TYPE aws_es_cpuutilization_average gauge“, because CPU usage can both increase and decrease.
See the excellent documentation VictoriaMetrics - Prometheus Metrics Explained: Counters, Gauges, Histograms & Summaries:
How can we use it in graphs?
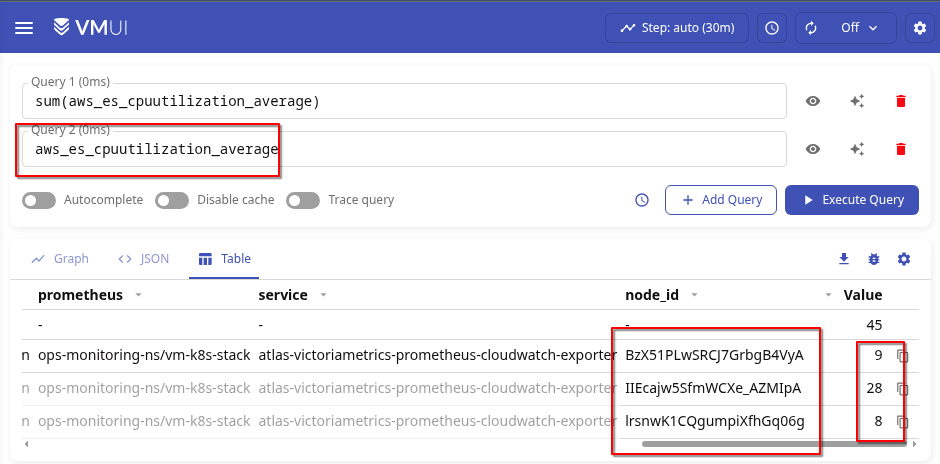
If we just look at the values, we have a set of labels here, each forming its own time series:
aws_es_cpuutilization_average{node_id=”BzX51PLwSRCJ7GrbgB4VyA”}== 9aws_es_cpuutilization_average{node_id=”IIEcajw5SfmWCXe_AZMIpA”}== 28aws_es_cpuutilization_average{node_id=”lrsnwK1CQgumpiXfhGq06g”}== 8
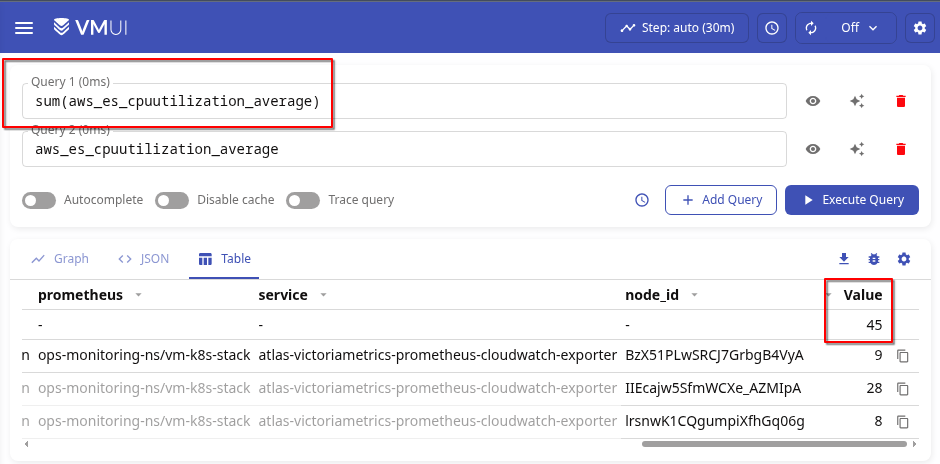
With sum() without a label, we simply get the sum of all values:
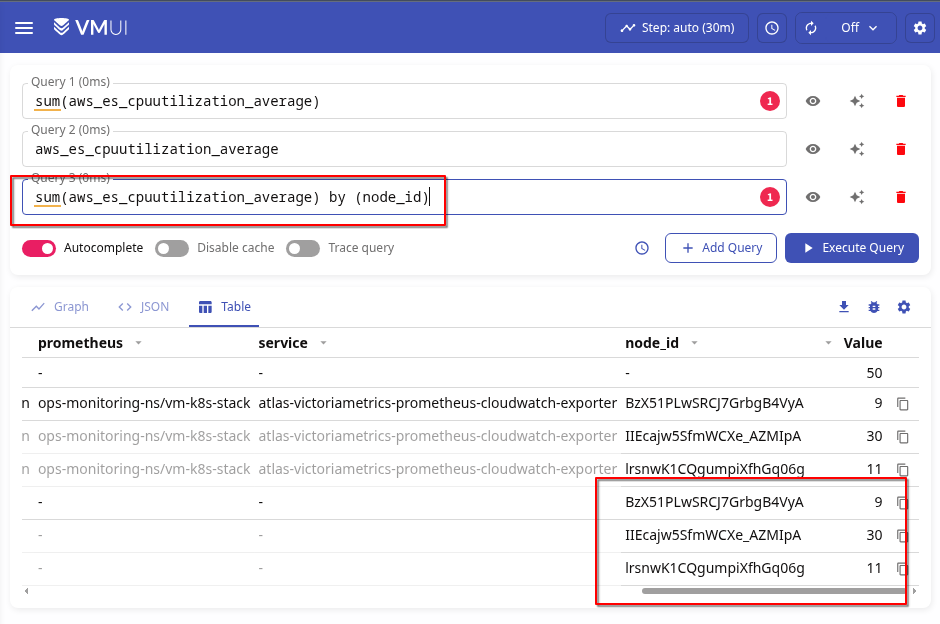
If we do sum by (node_id), we will get the value for a specific time series, which will coincide with the sample without sum by ():
(the meaning changes as I write and make inquiries)
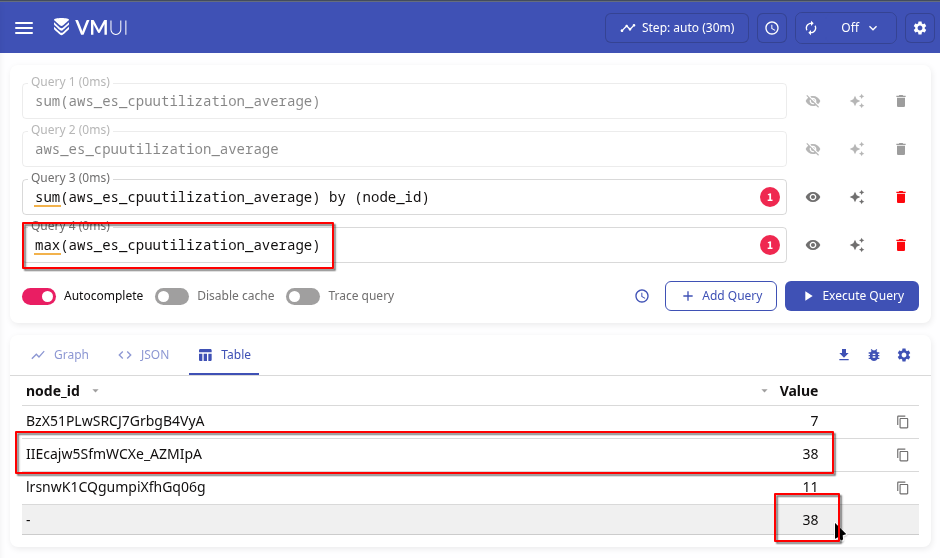
With max() without filters, we simply obtain the maximum value selected from all the time series received:
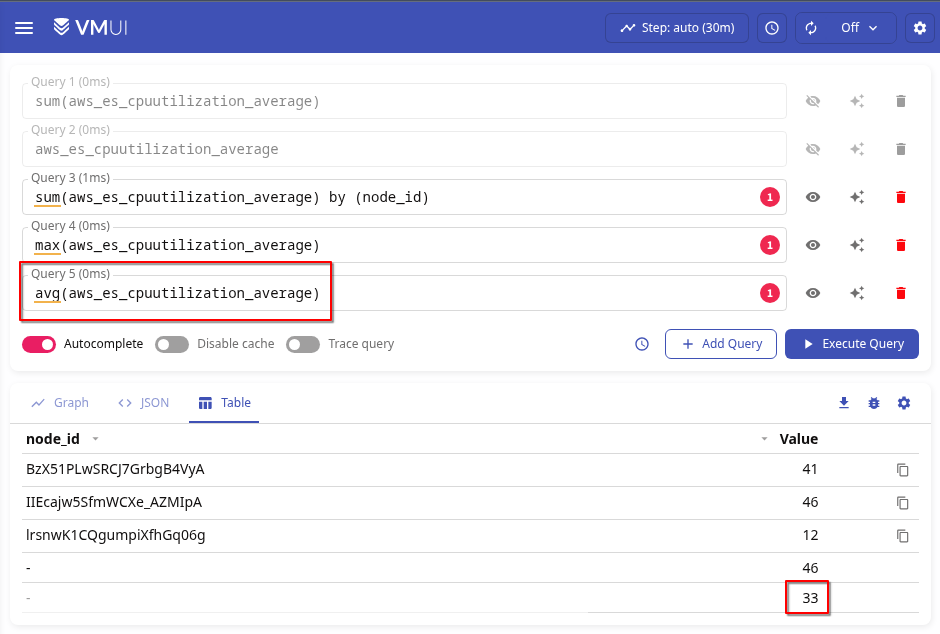
And with avg() - the average value of all values, i.e., the sum of all values divided by the number of time series:
Let’s calculate it ourselves:
(41+46+12)/3
33
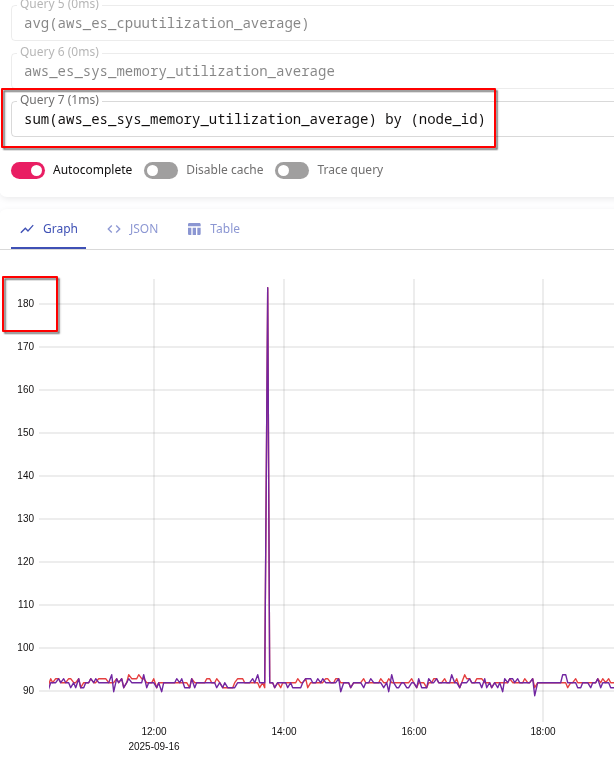
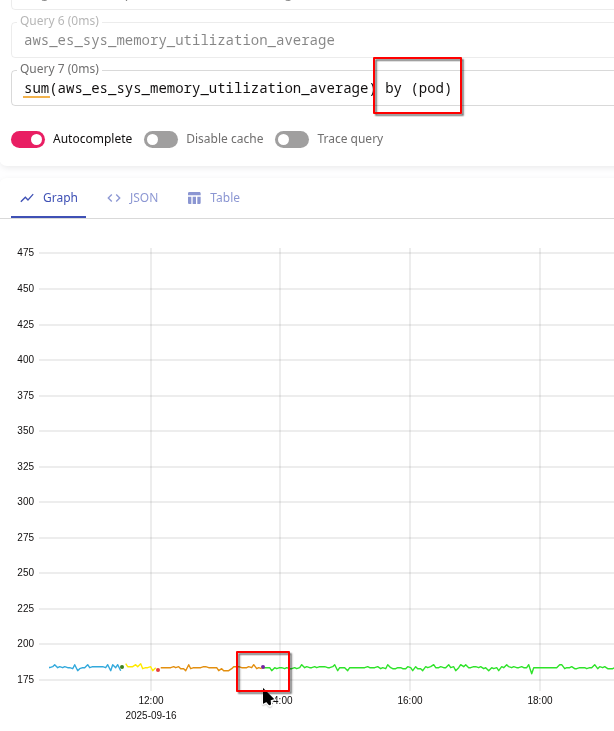
Actually, the reason I decided to write about this separately is because even with sum() and by (node_id), you can sometimes get the following results:
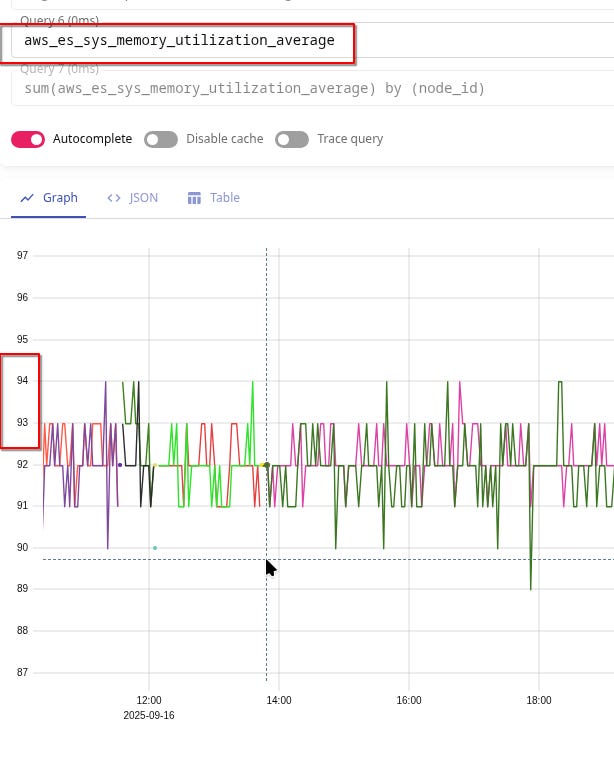
Although without sum() there are none:
And they happened because Pod was being recreated from CloudWatch Exporter at that moment:
And at that moment, we were receiving data from the old pod and the new one.
Therefore, the options here are to use either max() or simply avg(). Although max() is probably better, because we are interested in the “worst” indicators.
Okay, now that we’ve figured that out, let’s get started on the dashboard.
Cluster status
Here, I would like to see all three values - Green, Yellow, and Red - on a single Stats panel.
But since we don’t have if/else in Grafana, let’s make a workaround.
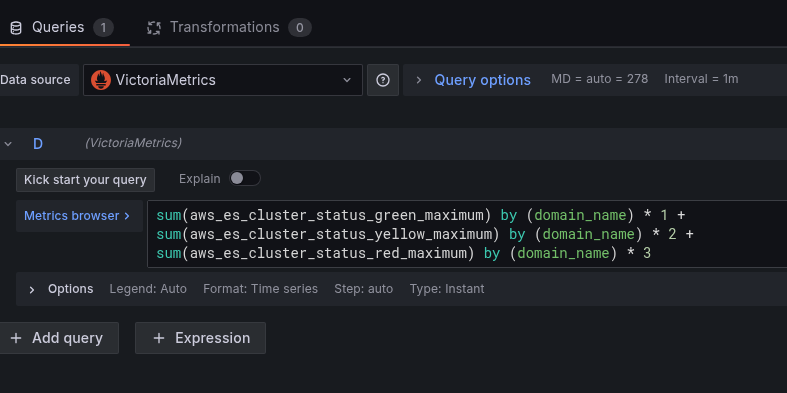
We collect all three metrics and multiply the result of each by 1, 2, or 3:
sum(aws_es_cluster_status_green_maximum) by (domain_name) * 1 +
sum(aws_es_cluster_status_yellow_maximum) by (domain_name) * 2 +
sum(aws_es_cluster_status_red_maximum) by (domain_name) * 3
Accordingly, if aws_es_cluster_status_green_maximum == 1, then 1 * 1 == 1, and aws_es_cluster_status_yellow_maximum == 0 and aws_es_cluster_status_red_maximum will be == 0, then the multiplication will return 0.
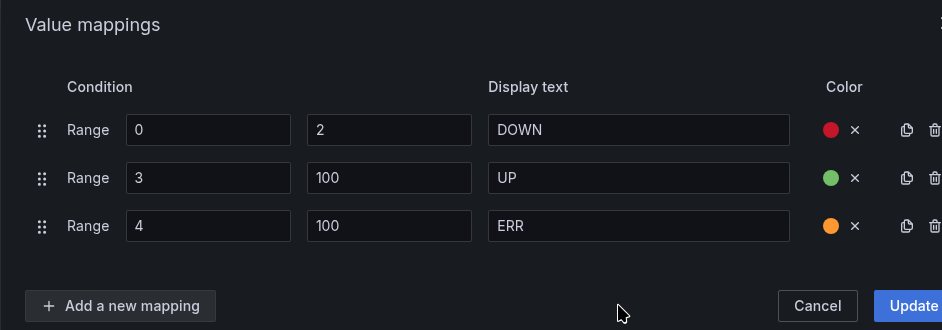
And if aws_es_cluster_status_green_maximum becomes 0, but aws_es_cluster_status_red_maximum is 1, then 1 * 2 equals 3, and based on the value 3, we will change the indicator in the Stats panel.
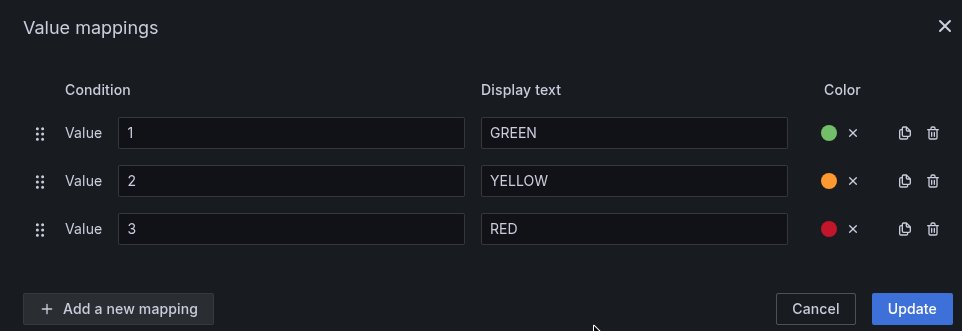
And add Value mappings with text and colors:
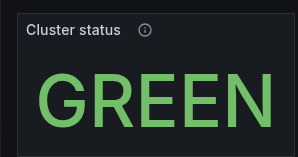
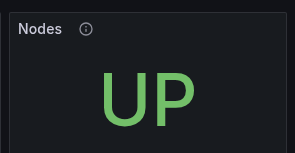
Get the following result:
Nodes status
It’s simple here - we know the required number, and we get the current one from aws_es_nodes_maximum:
sum(aws_es_nodes_maximum) by (domain_name)And again, using Value mappings, we set the values and colors:
In case we ever increase the number of nodes and forget to update the value for “OK” here, we add a third status, ERR:
CPUUtilization: Stats
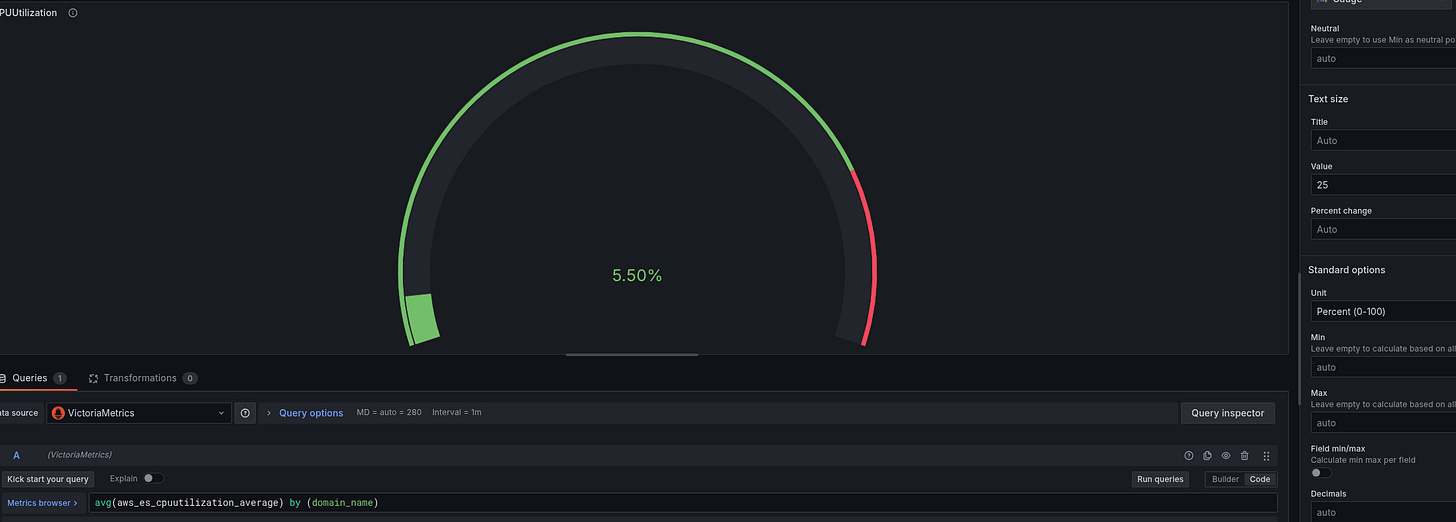
Here, we will make a cross-tabulation with the Gauge visualization type:
avg(aws_es_cpuutilization_average) by (domain_name)Set Text size and Unit:
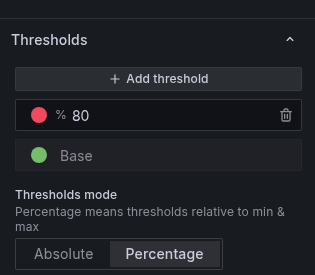
And Thresholds:
Description ChatGPT generates pretty well - useful for developers and for us in six months, or we can just take the description from AWS documentation:
The percentage of CPU usage for data nodes in the cluster. Maximum shows the node with the highest CPU usage. Average represents all nodes in the cluster.
Add the rest of the stats:
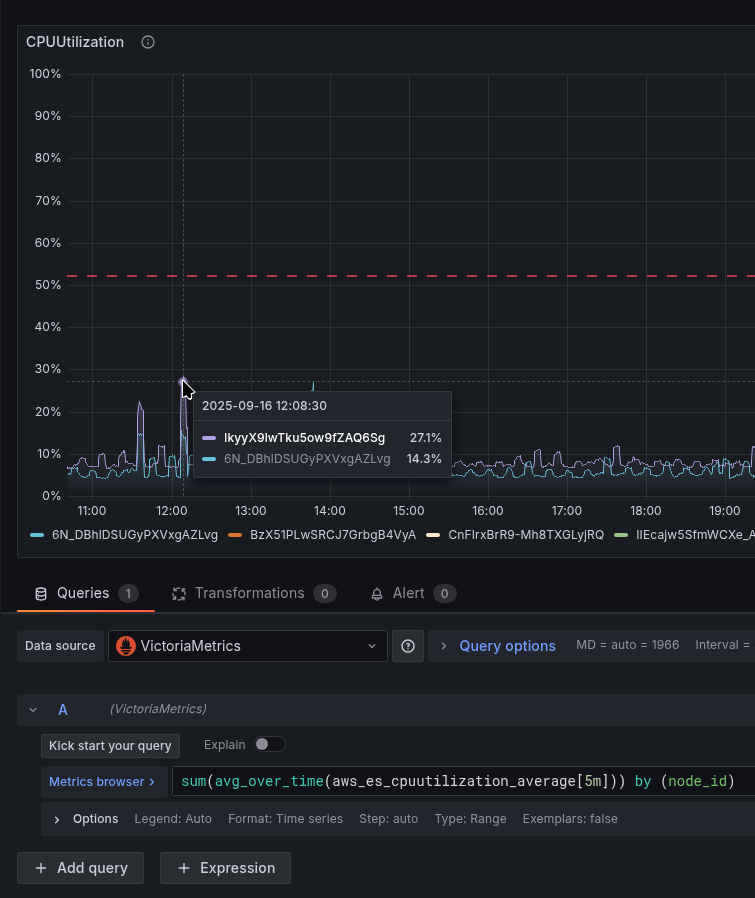
CPUUtilization: Graph
Here we will display a graph for the CPU of each node - the average over 5 minutes:
max(avg_over_time(aws_es_cpuutilization_average[5m])) by (node_id)And here is another example of how sum() created spikes that did not actually exist:
Therefore, we do max().
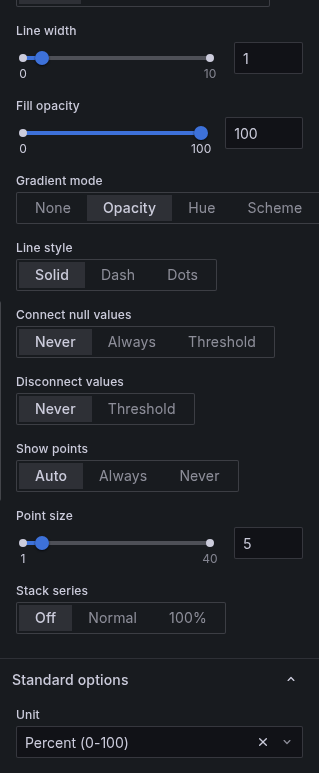
Set Gradient mode == Opacity, and Unit == percent:
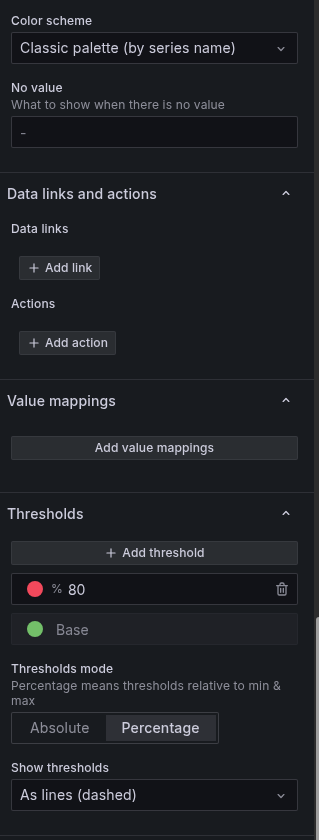
Set Color scheme and Thresholds, enable Show thresholds:
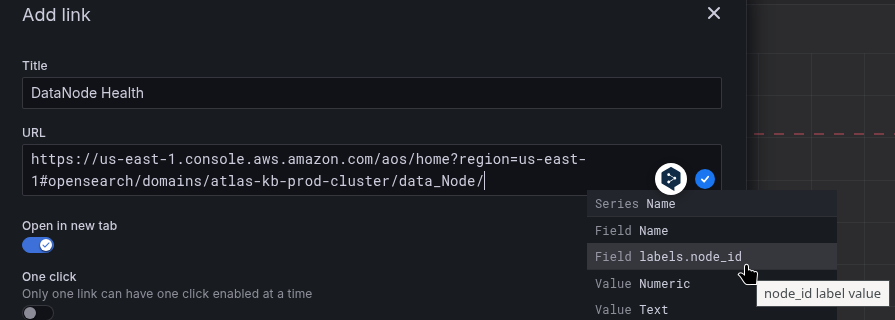
In Data links, you can set a link to the DataNode Health page in the AWS Console:
https://us-east-1.console.aws.amazon.com/aos/home?region=us-east-1#opensearch/domains/atlas-kb-prod-cluster/data_Node/${__field.labels.node_id}All available fields - Ctrl+Space:
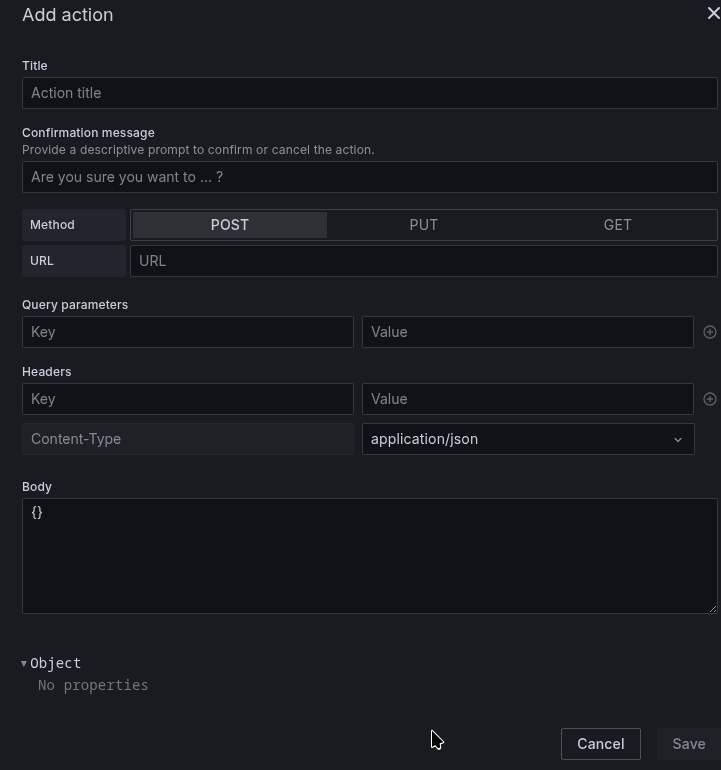
Actions seems to have appeared not so long ago. I haven’t used it yet, but it looks interesting - you can push something:
JVMMemoryPressure: Graph
Here, we are interested in seeing whether memory usage “sticks” and how often the Garbage Collector is launched.
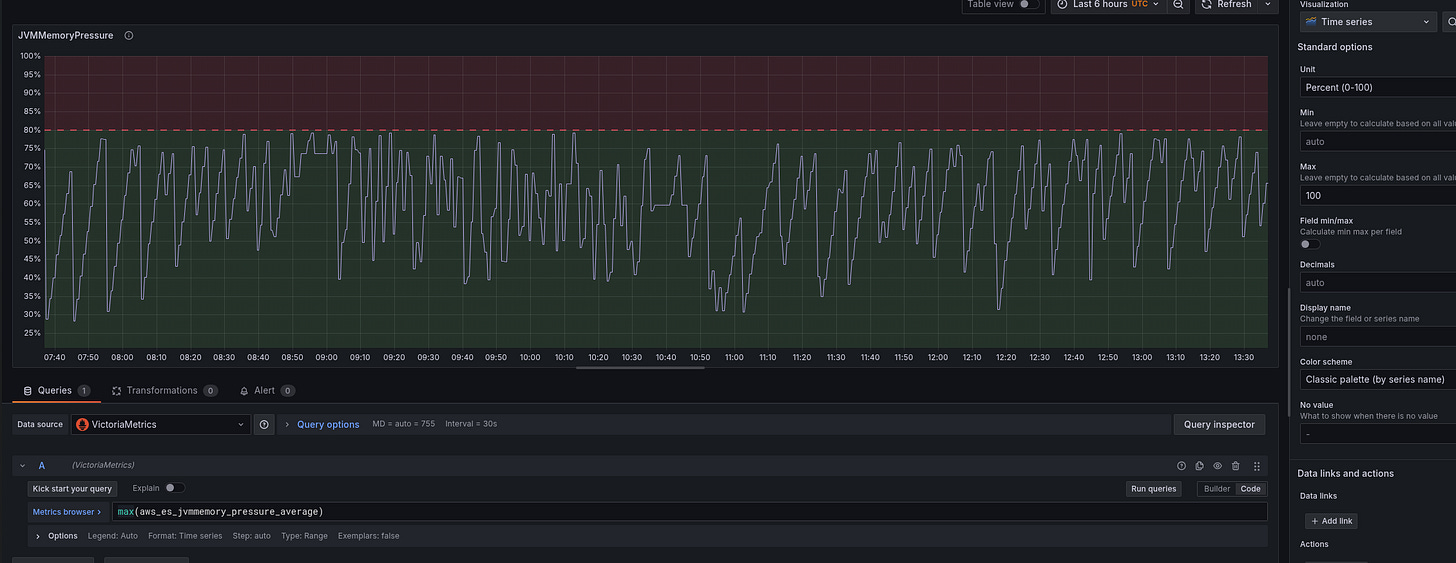
The request is simple - you can do max by (node_id), but I just made a general picture for the cluster:
max(aws_es_jvmmemory_pressure_average)And the schedule is similar to the previous one:
In Description, add the explanation “when to worry”:
Represents the percentage of JVM heap in use (young + old generation).
Values below 75% are normal. Sustained pressure above 80% indicates frequent GC and potential performance degradation.
Values consistently > 85–90% mean heap exhaustion risk and may trigger ClusterIndexWritesBlocked - investigate immediately.
JVMGCYoungCollectionCount and JVMGCOldCollectionCount
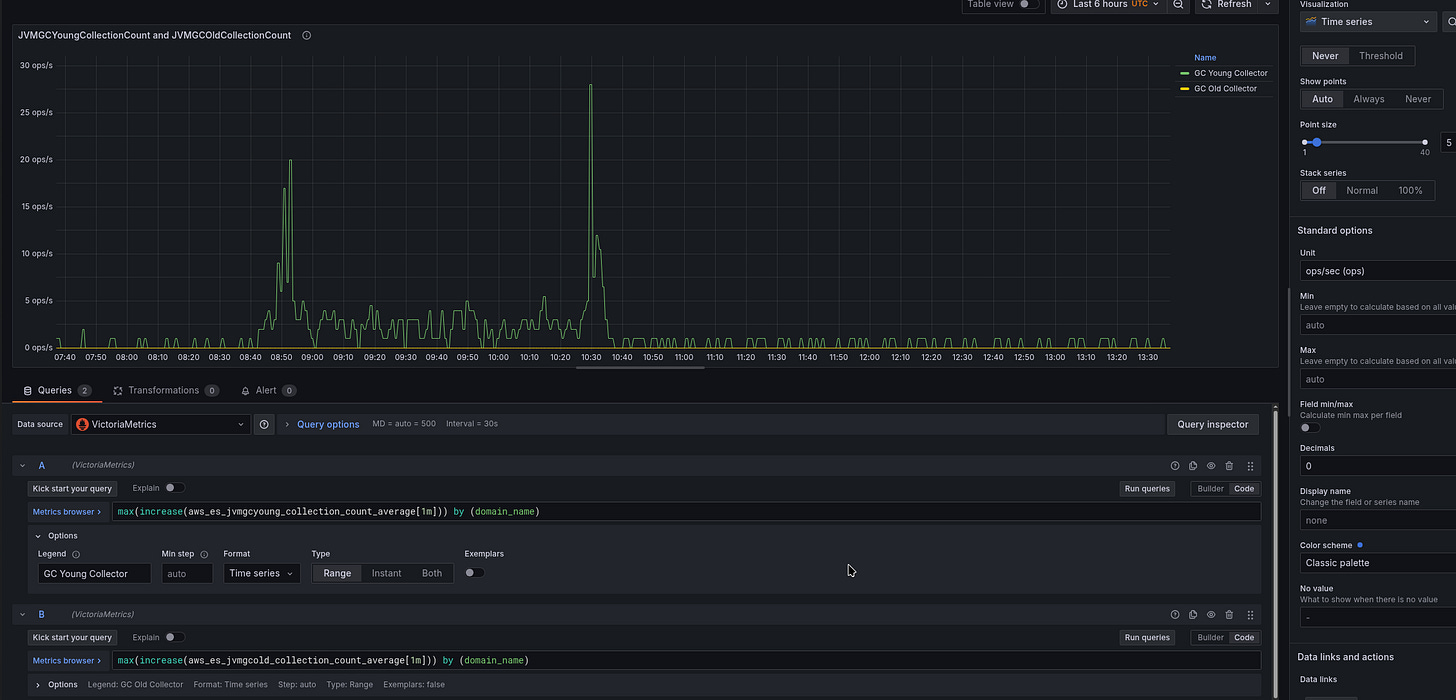
A very useful graph to see how often Garbage Collects are triggered.
In the query, we will use increase[1m] to see how the value has changed in a minute:
max(increase(aws_es_jvmgcyoung_collection_count_average[1m])) by (domain_name)And for Old Gen:
max(increase(aws_es_jvmgcold_collection_count_average[1m])) by (domain_name)Unit - ops/sec, Decimals set to 0 to have only integer values:
KNNHitCount vs KNNMissCount
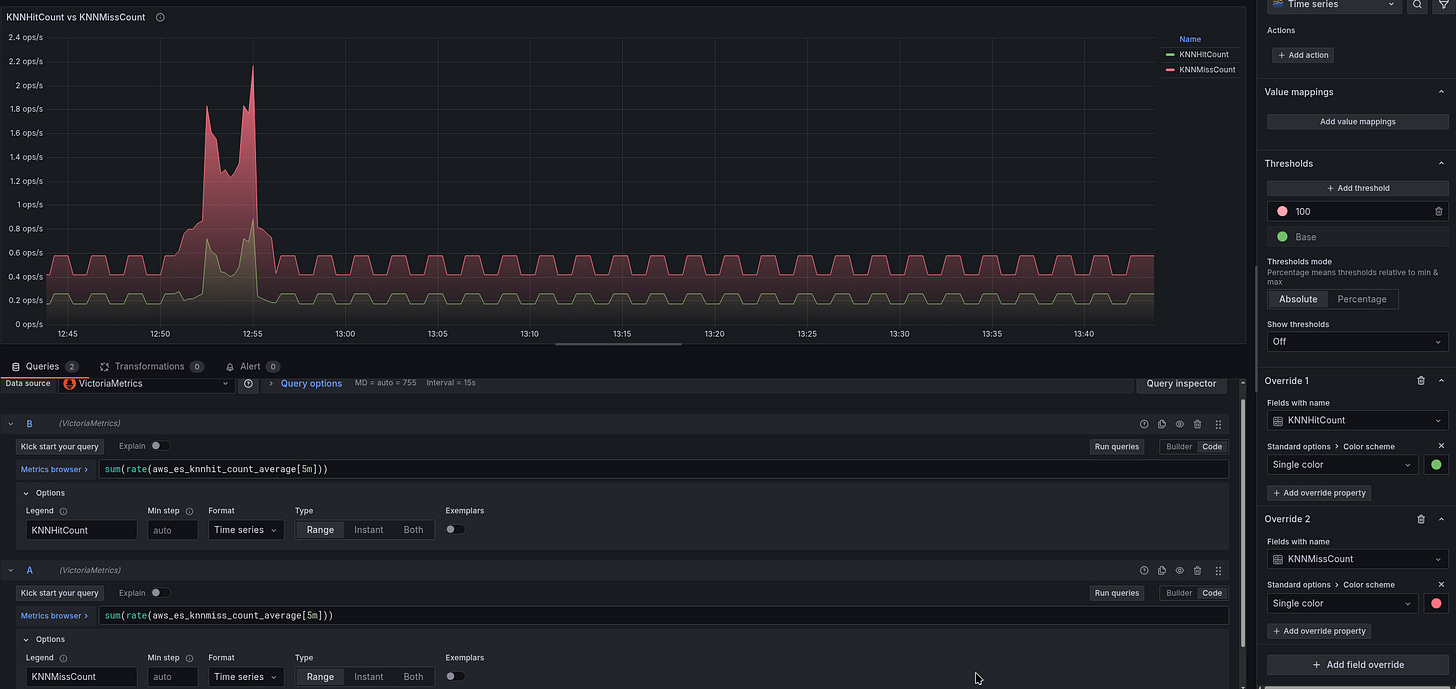
Here, we will generate data for a second - rate():
sum(rate(aws_es_knnhit_count_average[5m]))And for Cache Miss:
sum(rate(aws_es_knnmiss_count_average[5m]))Unit ops/s, colors can be set via Overrides:
The statistics here, by the way, are very mediocre - there are consistently a lot of cache misses, but we haven’t figured out why yet.
Final result
We collect all the graphs and get something like this:
t3.small.search vs t3.medium.search on graphs
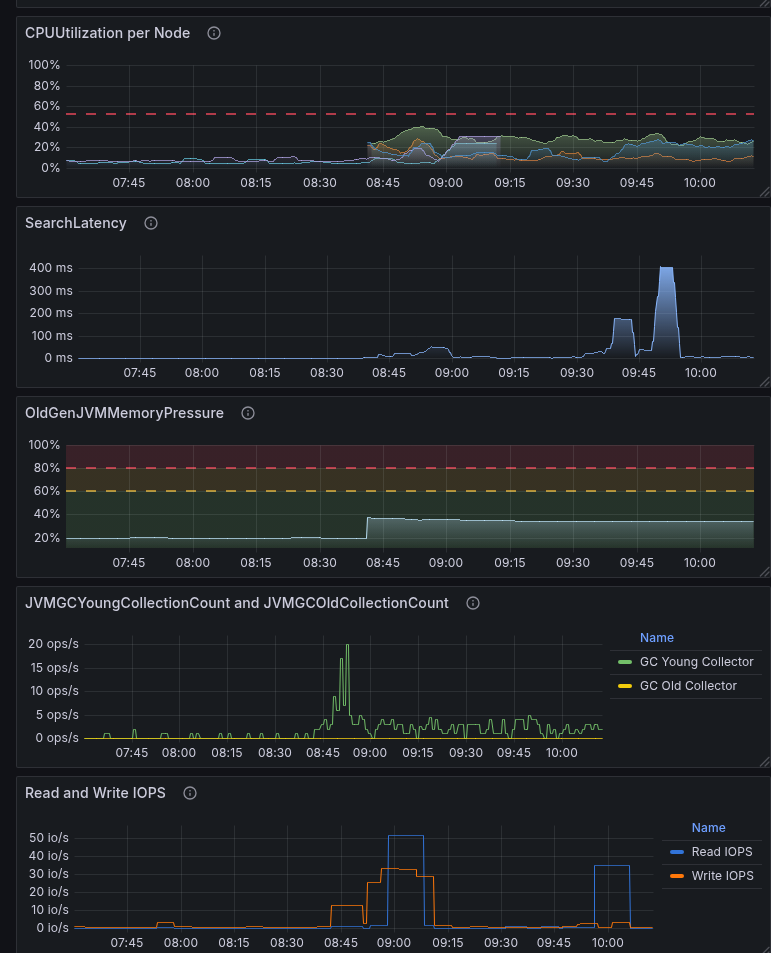
And here’s an example of how a lack of resources, primarily memory, is reflected in the graphs: we had t3.medium.search, then we switched back to t3.small.search to see how it would affect performance.
t3.small.search is only 2 gigabytes of memory and 2 CPU cores.
Of these 2 gigabytes of memory, 1 gigabyte was allocated to JVM Heap, 500 megabytes to k-NN memory, and 500 remained for other processes.
Well, the results are quite expected:
Garbage Collectors started running constantly because it was necessary to clean up the memory that was lacking.
Read IOPS increased because data was constantly being loaded from the disk to the JVM Heap Young and k-NN.
Search Latency increased because not all data was in the cache, and I/O operations from the disk were pending.
and CPU utilization jumped - because the CPU was loaded with Garbage Collectors and reading from the disk
Creating Alerts
You can also check out the recommendations from AWS - Recommended CloudWatch alarms for Amazon OpenSearch Service.
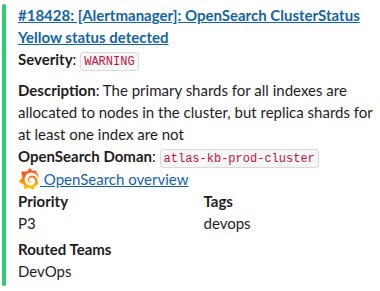
OpenSearch ClusterStatus Yellow and OpenSearch ClusterStatus Red: here, simply if more than 0:
...
      - alert: OpenSearch ClusterStatus Yellow
        expr: sum(aws_es_cluster_status_yellow_maximum) by (domain_name, node_id) > 0
        for: 1s
        labels:
          severity: warning
          component: backend
          environment: prod
        annotations:
          summary: ‘OpenSearch ClusterStatus Yellow status detected’
          description: |-
            The primary shards for all indexes are allocated to nodes in the cluster, but replica shards for at least one index are not
            *OpenSearch Doman*: `{{ “{{” }} $labels.domain_name }}`
          grafana_opensearch_overview_url: ‘https://{{ .Values.monitoring.root_url }}/d/b2d2dabd-a6b4-4a8a-b795-270b3e200a2e/aws-opensearch-cluster-cloudwatch’

      - alert: OpenSearch ClusterStatus Red
        expr: sum(aws_es_cluster_status_red_maximum) by (domain_name, node_id) > 0
        for: 1s
        labels:
          severity: critical
          component: backend
          environment: prod
        annotations:
          summary: ‘OpenSearch ClusterStatus RED status detected!’
          description: |-
            The primary and replica shards for at least one index are not allocated to nodes in the cluster
            *OpenSearch Doman*: `{{ “{{” }} $labels.domain_name }}`
          grafana_opensearch_overview_url: ‘https://{{ .Values.monitoring.root_url }}/d/b2d2dabd-a6b4-4a8a-b795-270b3e200a2e/aws-opensearch-cluster-cloudwatch’
...
Through labels, we have implemented alert routing in Opsgenie to the necessary Slack channels, and the annotation grafana_opensearch_overview_url is used to add a link to Grafana in a Slack message:
OpenSearch CPUHigh - if more than 20% for 10 minutes:
- alert: OpenSearch CPUHigh
        expr: sum(aws_es_cpuutilization_average) by (domain_name, node_id) > 20
        for: 10m
...
OpenSearch Data Node down - if the node is down:
- alert: OpenSearch Data Node down
        expr: sum(aws_es_nodes_maximum) by (domain_name) < 3
        for: 1s
        labels:
          severity: critical
...
aws_es_free_storage_space_maximum - we don’t need it yet.
OpenSearch Blocking Write - alert us if write blocks have started:
...
      - alert: OpenSearch Blocking Write
        expr: sum(aws_es_cluster_index_writes_blocked_maximum) by (domain_name) >= 1
        for: 1s
        labels:
          severity: critical
...
And the rest of the alerts I’ve added so far:
...
      - alert: OpenSearch AutomatedSnapshotFailure
        expr: sum(aws_es_automated_snapshot_failure_maximum) by (domain_name) >= 1
        for: 1s
        labels:
          severity: critical
...
      - alert: OpenSearch 5xx Errors
        expr: sum(aws_es_5xx_maximum) by (domain_name) >= 1
        for: 1s
        labels:
          severity: critical
...
      - alert: OpenSearch IopsThrottled
        expr: sum(aws_es_iops_throttle_maximum) by (domain_name) >= 1
        for: 1s
        labels:
          severity: warning
...
      - alert: OpenSearch ThroughputThrottled
        expr: sum(aws_es_throughput_throttle_maximum) by (domain_name) >= 1
        for: 1s
        labels:
          severity: warning
...
      - alert: OpenSearch SysMemoryUtilization High Warning
        expr: avg(aws_es_sys_memory_utilization_average) by (domain_name) >= 95
        for: 5m
        labels:
          severity: warning
...
      - alert: OpenSearch PrimaryWriteRejected High
        expr: sum(aws_es_primary_write_rejected_maximum) by (domain_name) >= 1
        for: 1s
        labels:
          severity: critical
...
      - alert: OpenSearch KNNGraphQueryErrors High
        expr: sum(aws_es_knngraph_query_errors_maximum) by (domain_name) >= 1
        for: 1s
        labels:
          severity: critical
...
      - alert: OpenSearch KNNCacheCapacityReached
        expr: sum(aws_es_knngraph_query_errors_maximum) by (domain_name) >= 1
        for: 1s
        labels:
          severity: warning
...
As we use it, we’ll see what else we can add.
Originally published at RTFM: Linux, DevOps, and system administration.
![RTFM! DevOps[at]UA](https://substackcdn.com/image/fetch/$s_!ruIs!,w_80,h_80,c_fill,f_auto,q_auto:good,fl_progressive:steep,g_auto/https%3A%2F%2Fsubstack-post-media.s3.amazonaws.com%2Fpublic%2Fimages%2F78e47926-bd0f-4929-a081-2588cc2a3d82_90x95.jpeg)


