![RTFM! DevOps[at]UA](https://substackcdn.com/image/fetch/$s_!ruIs!,w_80,h_80,c_fill,f_webp,q_auto:good,fl_progressive:steep,g_auto/https%3A%2F%2Fsubstack-post-media.s3.amazonaws.com%2Fpublic%2Fimages%2F78e47926-bd0f-4929-a081-2588cc2a3d82_90x95.jpeg)
![RTFM! DevOps[at]UA](https://substackcdn.com/image/fetch/$s_!ruIs!,w_36,h_36,c_fill,f_webp,q_auto:good,fl_progressive:steep,g_auto/https%3A%2F%2Fsubstack-post-media.s3.amazonaws.com%2Fpublic%2Fimages%2F78e47926-bd0f-4929-a081-2588cc2a3d82_90x95.jpeg)
Grafana Labs: Loki — distributed system, labels and filters
The previous post — Grafana Labs: Loki — logs collecting and monitoring system.


The previous post — Grafana Labs: Loki — logs collecting and monitoring system.
There Loki, promtail, and Grafana were configured on the same host in one Docker Compose stack.
Now I want to try some distributed setup:
Grafana will work on a one host
Loki — on the other one
Promtail — will collect logs from a third one
The idea is next:
we have a Dev environment with 2 servers
we have a dedicated monitoring stack with Grafana, Prometheus etc
On the Dev environment, we will run our promtail's agents which will collect and PUSH data to Loki.
Grafana will use Loki as its data source to display logs on a dashboard.
In general, this will look like next (the scheme was made using the https://cloudcraft.co):
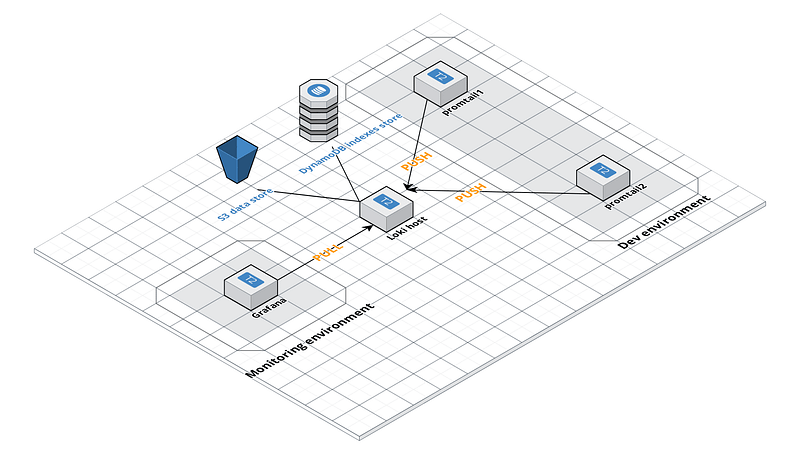
In the next post — we will configure Loki to use ASW DynamoDB and AWS S3 bucket to store data and indexes.
Preparing hosts
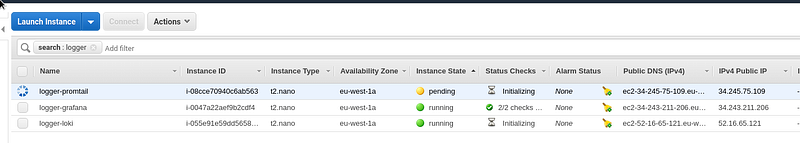
Let’s start three servers:
And create three domains to be used:
11 promtail.setevoy.org.ua
12 loki.setevoy.org.ua
13 grafana.setevoy.org.ua
Promtail
Start with the promtail.
We’d like to collect NGINX logs and then push them to the Loki instance.
Create the promtail-conf.yml file:
server:

  http_listen_port: 9080
  grpc_listen_port: 0

positions:

  filename: /tmp/positions.yaml

client:

  url: http://loki.setevoy.org.ua:3100/api/prom/push

scrape_configs:

  - job_name: system
    entry_parser: raw
    static_configs:
    - targets:
        - localhost
      labels:
        job: varlogs
        __path__: /var/log/*log

  - job_name: nginx
    entry_parser: raw
    static_configs:
    - targets:
        - localhost
      labels:
        job: nginx
        __path__: /var/log/nginx/*log
Create a Compose file to run promtail's container - promtail-compose.yml:
version: "3"

services:

  promtail:
    image: grafana/promtail:master
    volumes:
      - /home/admin/promtail-conf.yml:/etc/promtail/docker-config.yaml
      - /var/log:/var/log
    command: -config.file=/etc/promtail/docker-config.yaml
Run it:
root@ip-172–31–32–175:/home/admin# docker-compose -f promtail-compose.yml up -dCheck if it’s working:
root@ip-172–31–32–175:/home/admin# curl -s localhost:9080/metrics | head -5
#HELP go_gc_duration_seconds A summary of the GC invocation durations.
#TYPE go_gc_duration_seconds summary
go_gc_duration_seconds{quantile=”0.0"} 3.6174e-05
go_gc_duration_seconds{quantile=”0.25"} 3.6174e-05
go_gc_duration_seconds{quantile=”0.5"} 4.6829e-05
Loki
Now go to the Loki’s host.
Create a new Loki’s config here -loki-conf.yml:
auth_enabled: false

server:
  http_listen_port: 3100

ingester:
  lifecycler:
    address: 0.0.0.0
    ring:
      store: inmemory
      replication_factor: 1
  chunk_idle_period: 15m

schema_config:
  configs:
  - from: 0
    store: boltdb
    object_store: filesystem
    schema: v9
    index:
      prefix: index_
      period: 168h

storage_config:
  boltdb:
    directory: /tmp/loki/index

  filesystem:
    directory: /tmp/loki/chunks

limits_config:
  enforce_metric_name: false
In the address: 0.0.0.0 we set to listen all available interfaces as we want to make it accessible via the Internet.
Create a Compose file — loki-compose.yml:
version: "3"

services:
  loki:
    image: grafana/loki:master
    volumes:
      - /home/admin/loki-conf.yml:/etc/loki/local-config.yaml
    ports:
      - "3100:3100"
    command: -config.file=/etc/loki/local-config.yaml
Run it:
root@ip-172–31–38–97:/home/admin# docker-compose -f loki-compose.yml up -d
Starting admin_loki_1 … done
Check:
root@ip-172–31–38–97:/home/admin# curl -s localhost:3100/metrics | head -5
#HELP cortex_cache_corrupt_chunks_total Total count of corrupt chunks found in cache.
#TYPE cortex_cache_corrupt_chunks_total counter
cortex_cache_corrupt_chunks_total 0.0
#HELP cortex_chunk_store_chunks_per_query Distribution of #chunks per query.
#TYPE cortex_chunk_store_chunks_per_query histogram
Good.
Now let’s try to connect from the promtail-host:
root@ip-172–31–32–175:/home/admin# curl -s loki.setevoy.org.ua:3100/metrics | head -5
#HELP cortex_cache_corrupt_chunks_total Total count of corrupt chunks found in cache.
#TYPE cortex_cache_corrupt_chunks_total counter
cortex_cache_corrupt_chunks_total 0.0
#HELP cortex_chunk_store_chunks_per_query Distribution of #chunks per query.
#TYPE cortex_chunk_store_chunks_per_query histogram
All good so far.
Grafana
On the Grafana’s host create a Compose file to run a Grafana container — grafana-compose.yml:
version: "3"

services:
  grafana:
    image: grafana/grafana:master
    ports:
      - "3000:3000"
Run it:
root@ip-172–31–43–174:/opt/loki# docker-compose -f grafana-compose.yml up -dCheck UI — http://grafana.setevoy.org.ua:3000:
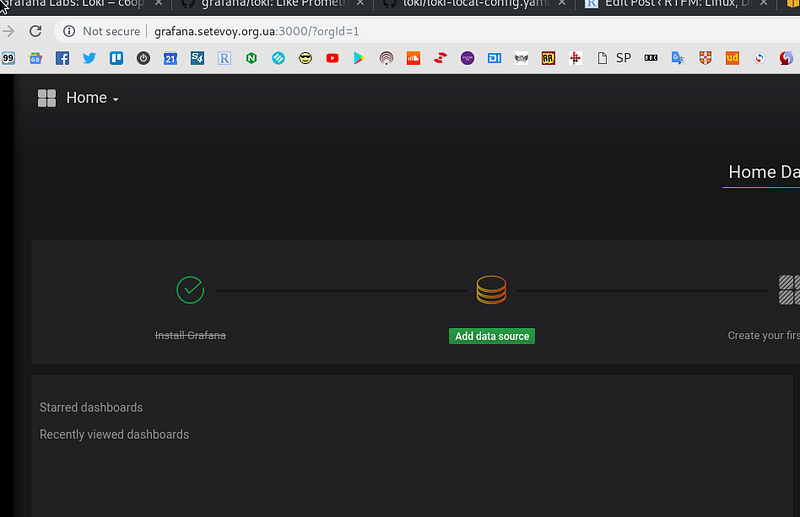
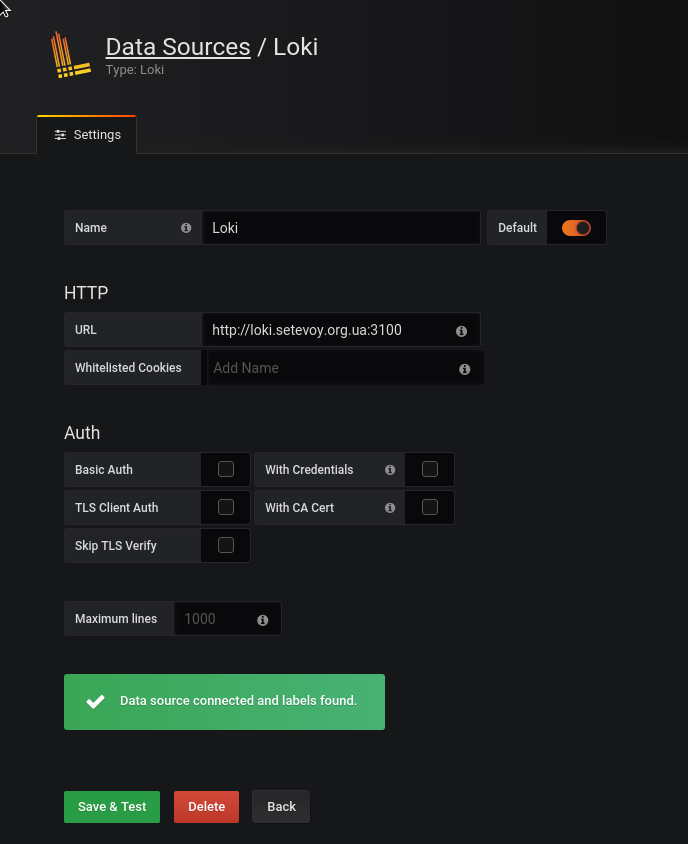
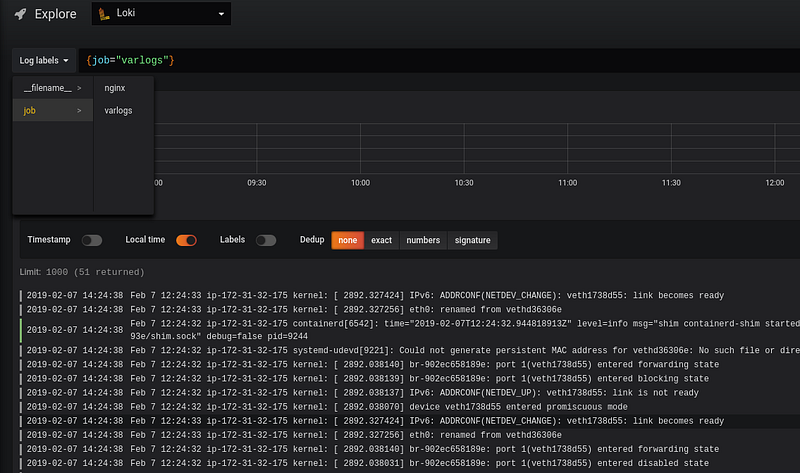
Configure a Loki data source:
Er…
And where are my logs?
And no nginx group here…
Let’s check promtail's logs:
root@ip-172–31–32–175:/home/admin# docker logs -f admin_promtail_1
…
l=error ts=2019–02–07T12:13:23.938327315Z caller=client.go:129 msg=”error sending batch” error=”Post http://loki.setevoy.org.ua:3100/api/prom/push: dial tcp 52.16.65.121:3100: connect: connection refused”
level=error ts=2019–02–07T12:13:24.946257437Z caller=client.go:129 msg=”error sending batch” error=”Post http://loki.setevoy.org.ua:3100/api/prom/push: dial tcp 52.16.65.121:3100: connect: connection refused”
Why?
Restart promtail's container:
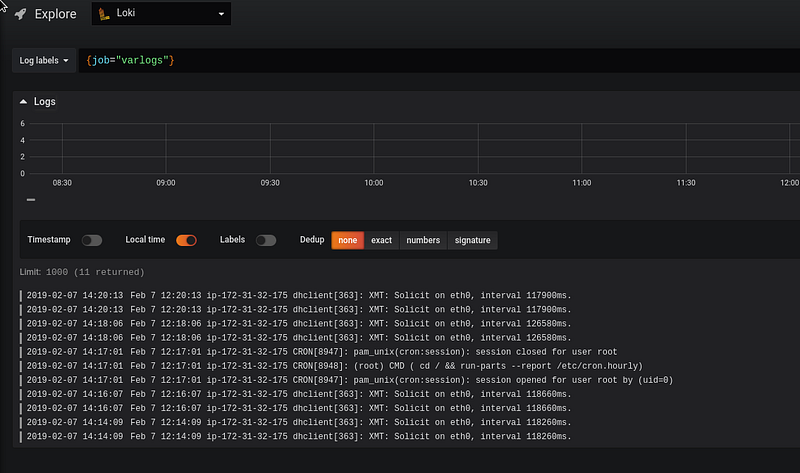
root@ip-172–31–32–175:/home/admin# docker-compose -f promtail-compose.yml restartAnd after a couple of minutes we have data in Grafana now:
Labels
Okay — all works now but we will have a bunch of Dev-servers with different hostnames and we want to have an ability to chose data in Grafana from different hosts, thus — need to have additional labels per each host.
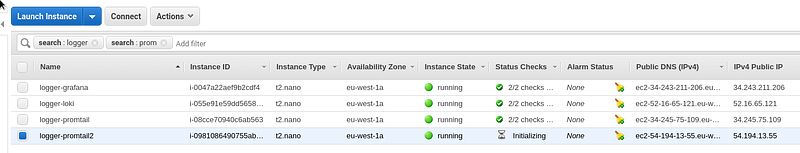
Let’s add a new host to have promtail there, similar to the first one:
Create a similar promtail2-conf.yml config there:
server:

  http_listen_port: 9080
  grpc_listen_port: 0

positions:

  filename: /tmp/positions.yaml

client:

  url: http://loki.setevoy.org.ua:3100/api/prom/push

scrape_configs:

  - job_name: system
    entry_parser: raw
    static_configs:
    - targets:
        - localhost
      labels:
        job: varlogs
        __path__: /var/log/*log

  - job_name: nginx
    entry_parser: raw
    static_configs:
    - targets:
        - localhost
      labels:
        job: nginx
        host: promtail2
        __path__: /var/log/nginx/*log
The only difference here is the host: promtail2 label.
Add the same job label with the promtail1 value on the first Dev's host:
...
      labels:
        job: nginx
        host: promtail1
        __path__: /var/log/nginx/*log
...
First I thought to add it via the global section using the external_labels, as I have it on my Prometheus production setup now:
global:

  scrape_interval:     15s
  external_labels:
    monitor: 'monitoring-production'

...
But Loki’s global has no such option:
Creating admin_promtail_1 … done
Attaching to admin_promtail_1
promtail_1 | level=error ts=2019–02–07T13:32:36.436335841Z caller=main.go:36 msg=”error loading config” filename=/etc/promtail/docker-config.yaml err=”yaml: unmarshal errors:\n line 1: field global not found in type api.Config”
As documentation has no information (yet) about available options — let’s check Loki’s source:
...

type Config struct {
  ServerConfig    server.Config    `yaml:"server,omitempty"`
  ClientConfig    client.Config    `yaml:"client,omitempty"`
  PositionsConfig positions.Config `yaml:"positions,omitempty"`
  ScrapeConfig    []ScrapeConfig   `yaml:"scrape_configs,omitempty"`
}

...

type ScrapeConfig struct {
  JobName                string                           `yaml:"job_name,omitempty"`
  EntryParser            EntryParser                      `yaml:"entry_parser"`
  RelabelConfigs         []*relabel.Config                `yaml:"relabel_configs,omitempty"`
  ServiceDiscoveryConfig sd_config.ServiceDiscoveryConfig `yaml:",inline"`
}

...
There are two structs describing available fields — general and the scrape_configs.
Create Compose file on the promtail2 host:
version: "3"

services:

  promtail:
    image: grafana/promtail:master
    volumes:
      - /home/admin/promtail2-conf.yml:/etc/promtail/docker-config.yaml
      - /var/log:/var/log
    command: -config.file=/etc/promtail/docker-config.yaml
    ports:
      - "9080:9080"
It’s also similar to our first one just file mapped to the container is /home/admin/promtail2-conf.yml instead of the /home/admin/promtail-conf.yml.
Restart container on the first host:
root@ip-172–31–32–175:/home/admin# docker-compose -f promtail-compose.yml restartStart it on the second one:
root@ip-172–31–44–176:/home/admin# docker-compose -f promtail-compose.yml up -dAnd got errors in its output — “watcher.Add: no such file or directory”:
promtail_1 | level=info ts=2019–02–07T13:55:05.004415129Z caller=filetargetmanager.go:165 msg=”Adding target” key=”{job=\”varlogs\”}”
promtail_1 | level=info ts=2019–02–07T13:55:05.004815207Z caller=filetargetmanager.go:165 msg=”Adding target” key=”{job=\”nginx\”}”
promtail_1 | level=error ts=2019–02–07T13:55:05.004981321Z caller=filetargetmanager.go:168 msg=”Failed to create target” key=”{job=\”nginx\”}” error=”watcher.Add: no such file or directory”
But all goo on the first one:
level=info ts=2019–02–07T13:43:52.153207236Z caller=filetargetmanager.go:165 msg=”Adding target” key=”{job=\”varlogs\”}”
level=info ts=2019–02–07T13:43:52.153657621Z caller=filetargetmanager.go:165 msg=”Adding target” key=”{host=\”promtail1\”, job=\”nginx\”}”
2019/02/07 13:43:52 Seeked /var/log/alternatives.log — &{Offset:19515 Whence:0}
WTF?
Um…
Did I have NGINX installed here at all?
root@ip-172–31–44–176:/home/admin# dpkg -l | grep nginxWell — no… :-)
root@ip-172–31–44–176:/home/admin# ls -l /var/log/nginx
ls: cannot access ‘/var/log/nginx’: No such file or directory
Now the “No such file or directory” error is clear.
Install NGINX and restart promtail:
root@ip-172–31–44–176:/home/admin# apt -y install nginxCheck its output now:
promtail_1 | level=info ts=2019–02–07T13:59:54.422710535Z caller=filetargetmanager.go:165 msg=”Adding target” key=”{job=\”varlogs\”}”
promtail_1 | level=info ts=2019–02–07T13:59:54.423260616Z caller=filetargetmanager.go:165 msg=”Adding target” key=”{host=\”promtail2\”, job=\”nginx\”}”
…
promtail_1 | level=info ts=2019–02–07T13:59:54.426593486Z caller=filetarget.go:269 msg=”start tailing file” path=/var/log/nginx/access.log
promtail_1 | level=info ts=2019–02–07T13:59:54.426667134Z caller=filetarget.go:269 msg=”start tailing file” path=/var/log/nginx/error.log
Good.
Go to the Grafana:
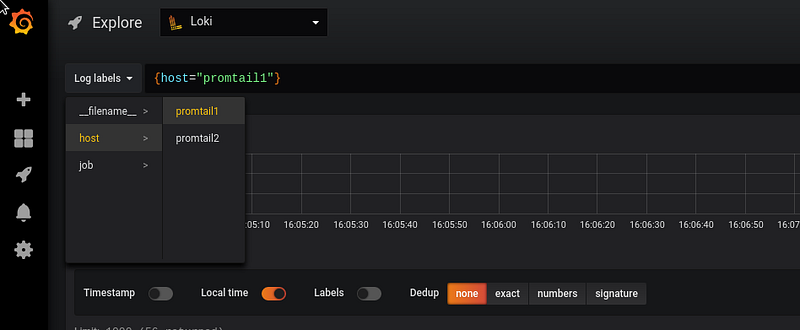
We got our two labels from our two hosts.
Loki’s querying filters examples
And the last thing for today — a few examples of how we can make search and filter results in Grafana.
The documentation available here>>>.
Let make some URL-request to our NGINX instance from some another host to have something in logs:
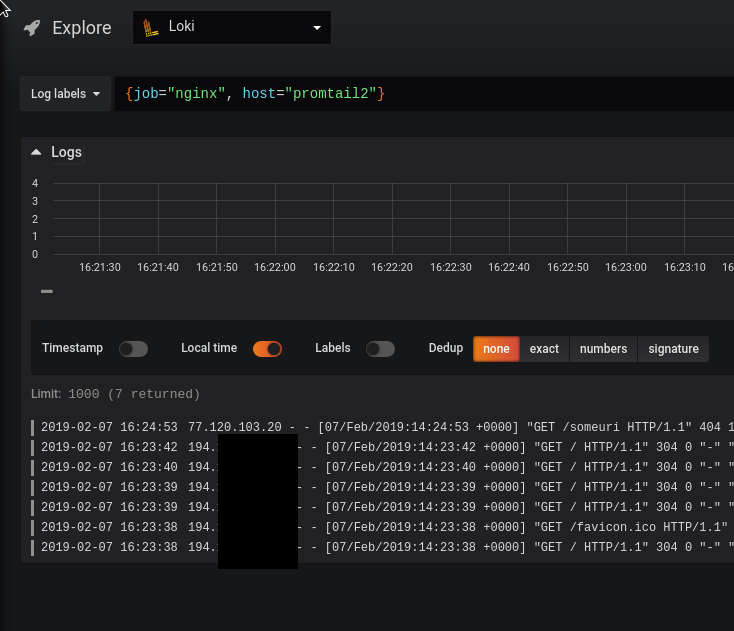
16:24:39 [setevoy@venti ~] $ curl http://54.194.13.55/someuriNow make search using the job == nginx and host == promtail2:
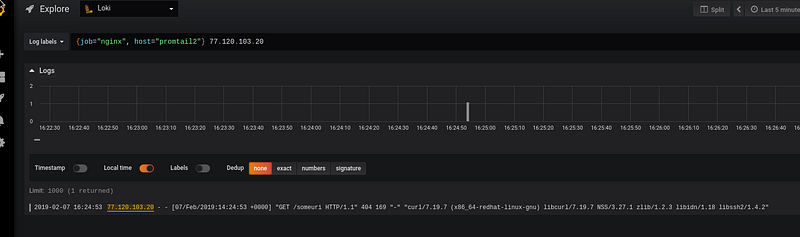
You can also filter results by the 77.120.103.20 IP only:
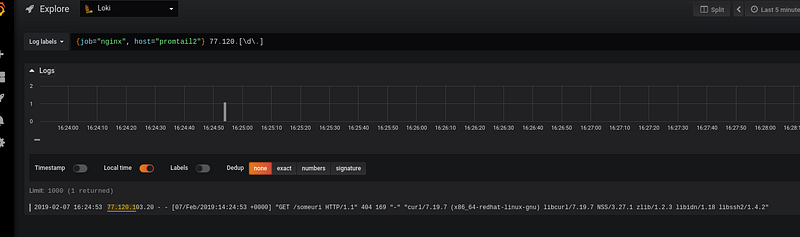
Or using regular expression:
{job="nginx", host="promtail2"} 77.120.[\d\.]
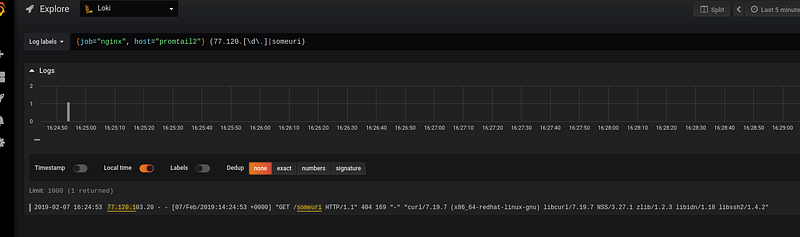
Or with the “IP by the 77.120.[\d\.] mask, or if there is the someuri word in requests”:
{job="nginx", host="promtail2"} (77.120.[\d\.]|someuri)
That’s all for now.
The next step will be to configure Loki with an AWS S3 bucket and AWS DynamoDB — and I’ll start rolling it out on our Staging environment.
Originally published at RTFM: Linux, DevOps and system administration.