![RTFM! DevOps[at]UA](https://substackcdn.com/image/fetch/$s_!ruIs!,w_80,h_80,c_fill,f_webp,q_auto:good,fl_progressive:steep,g_auto/https%3A%2F%2Fsubstack-post-media.s3.amazonaws.com%2Fpublic%2Fimages%2F78e47926-bd0f-4929-a081-2588cc2a3d82_90x95.jpeg)
![RTFM! DevOps[at]UA](https://substackcdn.com/image/fetch/$s_!ruIs!,w_36,h_36,c_fill,f_webp,q_auto:good,fl_progressive:steep,g_auto/https%3A%2F%2Fsubstack-post-media.s3.amazonaws.com%2Fpublic%2Fimages%2F78e47926-bd0f-4929-a081-2588cc2a3d82_90x95.jpeg)
Grafana Labs: Loki — logs collecting and monitoring system
Grafana 6.0 (still in Beta on the Feb 2019) the new feature was introduced — Loki, a log aggregation system available via another new…


Grafana 6.0 was still in Beta on Feb 2019, when the new feature was introduced — Loki, a log aggregation system available via another new ability — the Explore.
It’s similar to well-known ELK/EFK stack but more simple to set up and use and is intended to be used mostly with clouds and systems like Prometheus and Kubernetes.
It’s still in the early development stage and main disadvantage which I found during an attempt to set up the Proof of Concept described in this post is the lack of documentation and examples.
Thus — in this and a couple of next posts I’ll try to show a few its set up and usage examples.
In general, I liked Loki, because you don’t need to set up the whole dedicated ELK stack: the same Grafana can be used for your monitoring dashboards and all your logs are available via the same Grafana instance. So I’ll try to implement it on my current project.
Or will go back to the ELK solution…)
Project’s home page — here>>>, post in Grafana Lab’s blog — here>>>, and the Github repository here>>>.
There is also a good discussion on the Reddit here>>>.
Loki has thelogcli tool - but I didn't check it yet.
Loki-stack consists of three main components:
promtail- agent to collect logs on a host and push them to a Loki instanceloki- logs aggregation and processing serverGrafana — for querying and displaying logs
Now let’s try to set up it, add some NGINX logs and to check how it will look like in Grafana.
Loki Docker Compose stack
Create Loki’s home directory:
root@bttrm-dev-console:/opt# mkdir /opt/loki
root@bttrm-dev-console:/opt# cd /opt/loki/
Next, create a Docker Compose file — loki-compose.yml:
version: "3"

networks:
  loki:

services:
  loki:
    image: grafana/loki:master
    ports:
      - "3100:3100"
    command: -config.file=/etc/loki/local-config.yaml
    networks:
      - loki

  promtail:
    image: grafana/promtail:master
    volumes:
      - /var/log:/var/log
    command: -config.file=/etc/promtail/docker-config.yaml
    networks:
      - loki

  grafana:
    image: grafana/grafana:master
    ports:
      - "3000:3000"
    networks:
      - loki
Start containers:
root@bttrm-dev-console:/opt/loki# docker-compose -f loki-compose.yml upIn the promtail's output, you'll see information about logs watched by promatil:
…
promtail_1 | level=info ts=2019–02–05T14:07:30.777577365Z caller=filetargetmanager.go:165 msg=”Adding target” key=”{job=\”varlogs\”}”
promtail_1 | level=info ts=2019–02–05T14:07:30.779215957Z caller=filetarget.go:269 msg=”start tailing file” path=/var/log/daemon.log
promtail_1 | 2019/02/05 14:07:30 Seeked /var/log/alternatives.log — &{Offset:19515 Whence:0}
promtail_1 | level=info ts=2019–02–05T14:07:30.782000937Z caller=filetarget.go:269 msg=”start tailing file” path=/var/log/alternatives.log
promtail_1 | 2019/02/05 14:07:30 Seeked /var/log/auth.log — &{Offset:3869 Whence:0}
promtail_1 | level=info ts=2019–02–05T14:07:30.782899496Z caller=filetarget.go:269 msg=”start tailing file” path=/var/log/auth.log
promtail_1 | level=info ts=2019–02–05T14:07:30.783409465Z caller=filetarget.go:269 msg=”start tailing file” path=/var/log/bootstrap.log
promtail_1 | level=info ts=2019–02–05T14:07:30.78359605Z caller=filetarget.go:269 msg=”start tailing file” path=/var/log/cloud-init-output.log
promtail_1 | level=info ts=2019–02–05T14:07:30.783648219Z caller=filetarget.go:269 msg=”start tailing file” path=/var/log/cloud-init.log
promtail_1 | level=info ts=2019–02–05T14:07:30.784386768Z caller=filetarget.go:269 msg=”start tailing file” path=/var/log/dpkg.log
promtail_1 | level=info ts=2019–02–05T14:07:30.785801248Z caller=filetarget.go:269 msg=”start tailing file” path=/var/log/faillog
promtail_1 | level=info ts=2019–02–05T14:07:30.785871765Z caller=filetarget.go:269 msg=”start tailing file” path=/var/log/kern.log
promtail_1 | level=info ts=2019–02–05T14:07:30.785943765Z caller=filetarget.go:269 msg=”start tailing file” path=/var/log/lastlog
promtail_1 | level=info ts=2019–02–05T14:07:30.78598882Z caller=filetarget.go:269 msg=”start tailing file” path=/var/log/syslog
promtail_1 | level=info ts=2019–02–05T14:07:30.786064399Z caller=filetarget.go:269 msg=”start tailing file” path=/var/log/user.log
…
Similarly to Prometheus exporters — you can access data via the /metrics URI:
root@ip-172–31–43–174:/opt/loki# curl localhost:3100/metrics
#HELP cortex_cache_corrupt_chunks_total Total count of corrupt chunks found in cache.
#TYPE cortex_cache_corrupt_chunks_total counter
cortex_cache_corrupt_chunks_total 0.0
#HELP cortex_chunk_store_chunks_per_query Distribution of #chunks per query.
TYPE cortex_chunk_store_chunks_per_query histogram
cortex_chunk_store_chunks_per_query_bucket{le=”10.0"} 0.0
cortex_chunk_store_chunks_per_query_bucket{le=”80.0"} 0.0
cortex_chunk_store_chunks_per_query_bucket{le=”640.0"} 0.0
cortex_chunk_store_chunks_per_query_bucket{le=”5120.0"} 0.0
cortex_chunk_store_chunks_per_query_bucket{le=”40960.0"} 0.0
cortex_chunk_store_chunks_per_query_bucket{le=”327680.0"} 0.0
cortex_chunk_store_chunks_per_query_bucket{le=”+Inf”} 0.0
…
Now you can access your Grafana instance via http://IP:3000 URL:
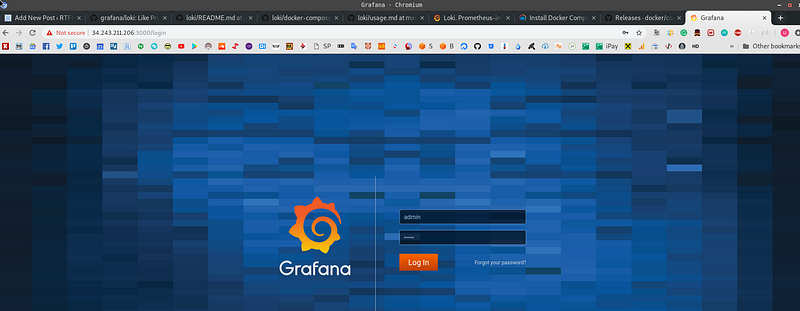
Login with the default credentials — admin:admin.
Adding Loki data source
Grafana will suggest you add a data source:
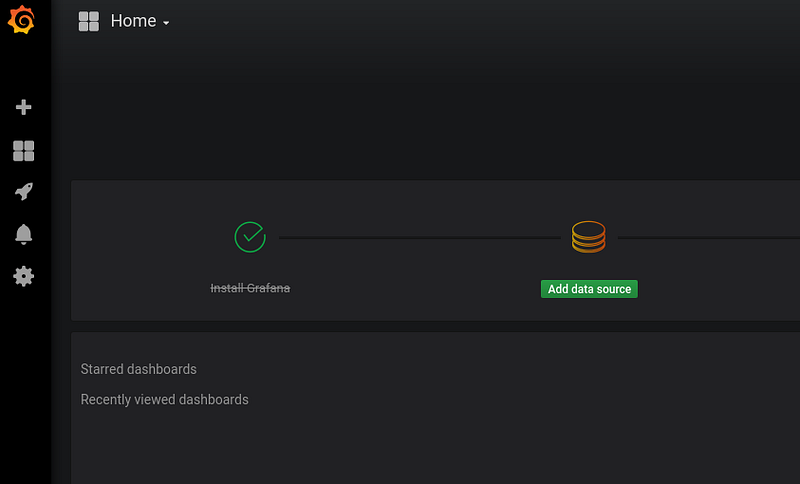
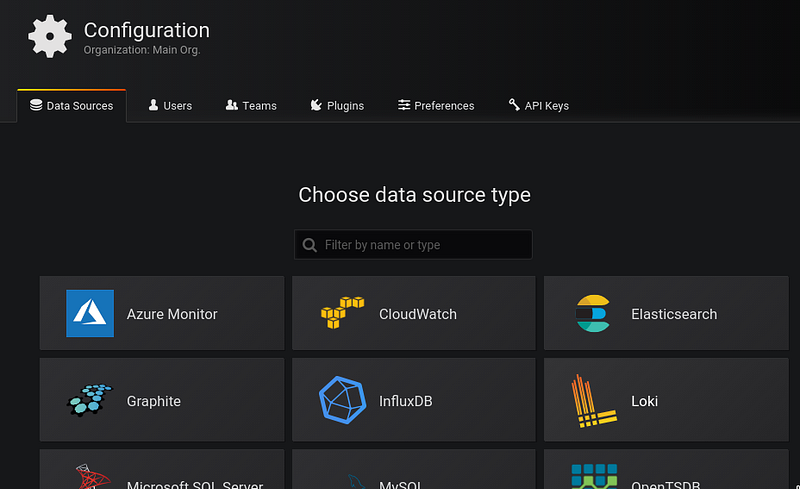
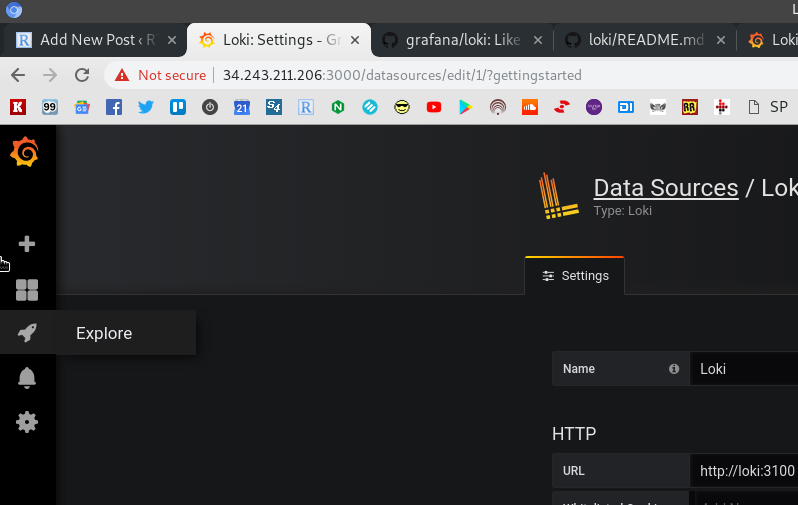
Add the Loki data source:
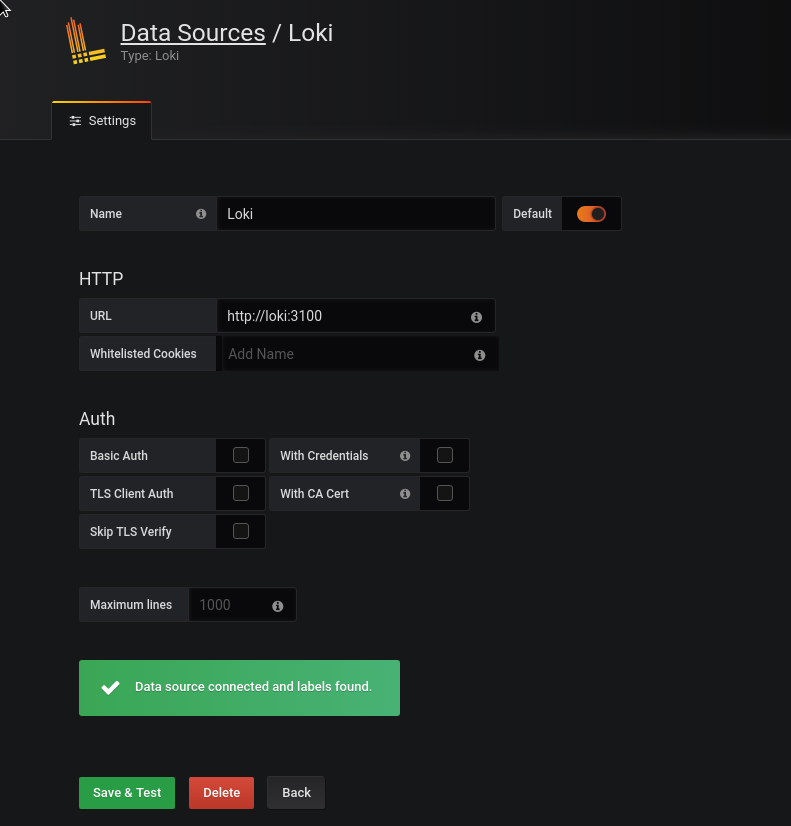
Set Loki’s URL as http://loki:3100 (as we are running our Loki’s stack in the Docker’s own network):
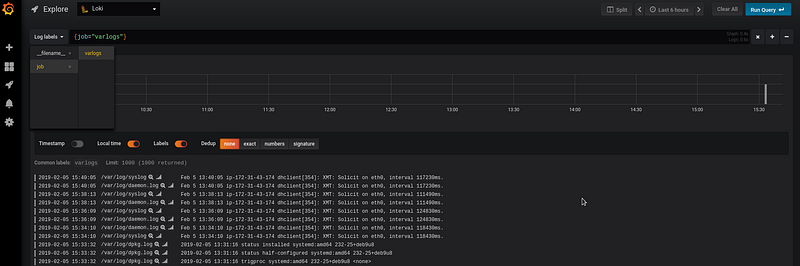
And now you can navigate to the Explore:
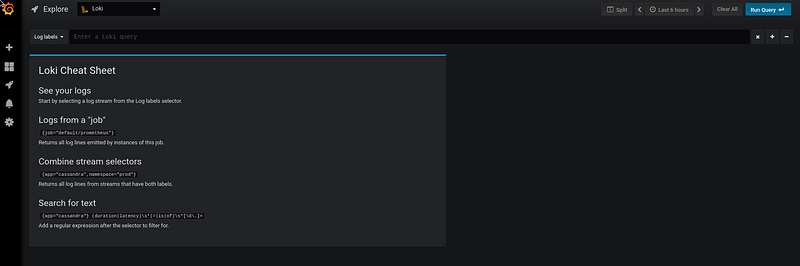
Check some already collected logs via the Log labels:
Adding new logs
Logs to be tailed are configured in the promtail's /etc/promtail/local-config.yaml or /etc/promtail/docker-config.yamlconfigs.
Now let’s install NGINX:
root@ip-172–31–43–174:/home/admin# apt install nginx -yCheck if log-files appeared on the host:
root@ip-172–31–43–174:/opt/loki# tail -f /var/log/nginx/*
==> /var/log/nginx/access.log <==
==> /var/log/nginx/error.log <==
==> /var/log/nginx/access.log <==
194.***.***.27 — — [05/Feb/2019:14:03:02 +0000] “GET / HTTP/1.1” 200 396 “-” “Mozilla/5.0 (X11; Linux x86_64) AppleWebKit/537.36 (KHTML, like Gecko) Chrome/71.0.3578.98 Safari/537.36”
194.***.***.27 — — [05/Feb/2019:14:03:03 +0000] “GET /favicon.ico HTTP/1.1” 404 200 “http://34.243.211.206/" “Mozilla/5.0 (X11; Linux x86_64) AppleWebKit/537.36 (KHTML, like Gecko) Chrome/71.0.3578.98 Safari/537.36”
Loki’s configuration file stored inside the container at this moment in the /etc/loki directory:
root@ip-172–31–43–174:/opt/loki# docker exec -ti loki_loki_1 ls -l /etc/loki/
total 4
-rw-r — r — 1 root root 489 Feb 5 12:00 local-config.yamlpromtail's - in /etc/promtail:
root@ip-172–31–43–174:/opt/loki# docker exec -ti loki_promtail_1 ls -l /etc/promtail/
total 8
-rw-r — r — 1 root root 312 Feb 5 12:00 docker-config.yaml
-rw-r — r — 1 root root 317 Feb 5 12:00 local-config.yaml
Let’s create own configuration for promtail- /opt/loki/loki-promtail-conf.yml:
server:

  http_listen_port: 9080
  grpc_listen_port: 0

positions:

  filename: /tmp/positions.yaml

client:

  url: http://loki:3100/api/prom/push

scrape_configs:

  - job_name: system
    entry_parser: raw
    static_configs:
    - targets:
        - localhost
      labels:
        job: varlogs
        __path__: /var/log/*log

  - job_name: nginx
    entry_parser: raw
    static_configs:
    - targets:
        - localhost
      labels:
        job: nginx
        __path__: /var/log/nginx/*log
Here in the scrape_configs we added a new job - nginx with the __path__ to the directory and files to be tailed by the promtail.
Next, let’s update our Compose file and add the new config file mapping from our host inside the promtail's container as /etc/promtail/docker-config.yaml:
...
  promtail:
    image: grafana/promtail:master
    volumes:
      - /opt/loki/loki-promtail-conf.yml:/etc/promtail/docker-config.yaml
      - /var/log:/var/log
    command: -config.file=/etc/promtail/docker-config.yaml
    networks:
      - loki
...
Restart Compose stack and check logs in the promtail's output to see which logs are watched by the promtail now:
…
promtail_1 | level=info ts=2019–02–05T15:08:10.53723788Z caller=filetargetmanager.go:165 msg=”Adding target” key=”{job=\”varlogs\”}”
promtail_1 | level=info ts=2019–02–05T15:08:10.538575763Z caller=filetarget.go:269 msg=”start tailing file” path=/var/log/daemon.log
promtail_1 | level=info ts=2019–02–05T15:08:10.539914281Z caller=filetarget.go:269 msg=”start tailing file” path=/var/log/dpkg.log
promtail_1 | level=info ts=2019–02–05T15:08:10.541431662Z caller=filetarget.go:269 msg=”start tailing file” path=/var/log/alternatives.log
promtail_1 | level=info ts=2019–02–05T15:08:10.541911162Z caller=filetarget.go:269 msg=”start tailing file” path=/var/log/auth.log
promtail_1 | level=info ts=2019–02–05T15:08:10.542352516Z caller=filetarget.go:269 msg=”start tailing file” path=/var/log/bootstrap.log
promtail_1 | level=info ts=2019–02–05T15:08:10.542780189Z caller=filetarget.go:269 msg=”start tailing file” path=/var/log/cloud-init-output.log
promtail_1 | level=info ts=2019–02–05T15:08:10.543222436Z caller=filetarget.go:269 msg=”start tailing file” path=/var/log/cloud-init.log
promtail_1 | level=info ts=2019–02–05T15:08:10.54394579Z caller=filetargetmanager.go:165 msg=”Adding target” key=”{job=\”nginx\”}”
promtail_1 | level=info ts=2019–02–05T15:08:10.54473202Z caller=filetarget.go:269 msg=”start tailing file” path=/var/log/faillog
promtail_1 | level=info ts=2019–02–05T15:08:10.545166611Z caller=filetarget.go:269 msg=”start tailing file” path=/var/log/kern.log
promtail_1 | level=info ts=2019–02–05T15:08:10.54564307Z caller=filetarget.go:269 msg=”start tailing file” path=/var/log/lastlog
promtail_1 | level=info ts=2019–02–05T15:08:10.546097865Z caller=filetarget.go:269 msg=”start tailing file” path=/var/log/syslog
promtail_1 | level=info ts=2019–02–05T15:08:10.54651553Z caller=filetarget.go:269 msg=”start tailing file” path=/var/log/user.log
promtail_1 | 2019/02/05 15:08:10 Seeked /var/log/alternatives.log — &{Offset:0 Whence:0}
promtail_1 | 2019/02/05 15:08:10 Seeked /var/log/auth.log — &{Offset:0 Whence:0}
promtail_1 | 2019/02/05 15:08:10 Seeked /var/log/nginx/access.log — &{Offset:0 Whence:0}
promtail_1 | level=info ts=2019–02–05T15:08:10.548790452Z caller=filetarget.go:269 msg=”start tailing file” path=/var/log/nginx/access.log
promtail_1 | 2019/02/05 15:08:10 Seeked /var/log/nginx/error.log — &{Offset:0 Whence:0}
promtail_1 | level=info ts=2019–02–05T15:08:10.54959973Z caller=filetarget.go:269 msg=”start tailing file” path=/var/log/nginx/error.log
…
key=”{job=\”nginx\”}” appeared — all good.
Let it work for a couple of minutes and check inside Grafana:
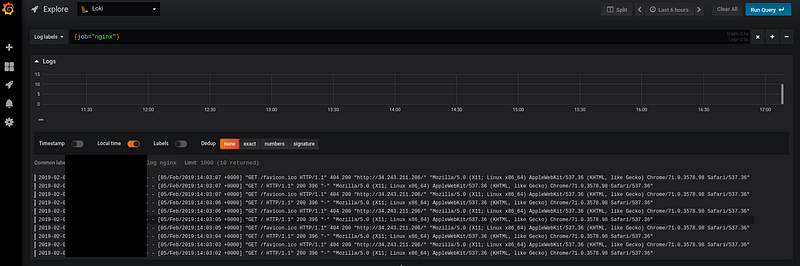
Logs present and we are done for now.
Check the next post — Grafana Labs: Loki — distributed system, labels and filters to see an example of how to set up a distributed system and tags and filters usage example.
Originally published at RTFM: Linux, DevOps and system administration.